Scalper1 News
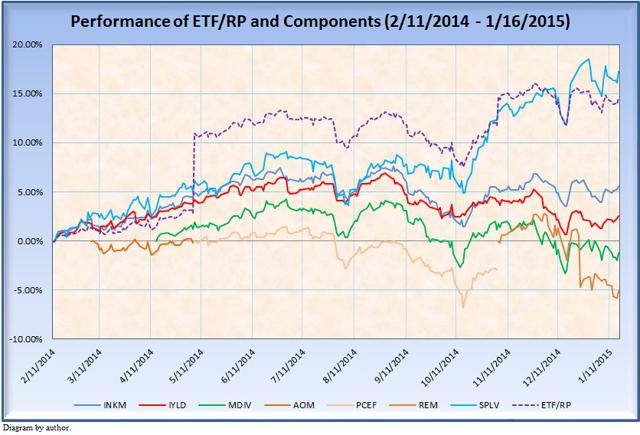
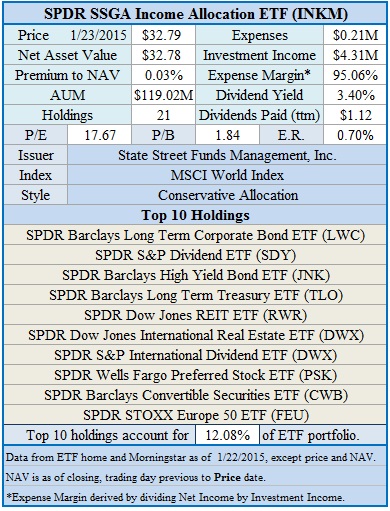
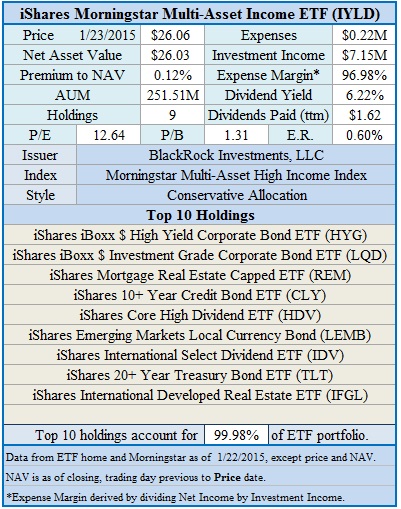
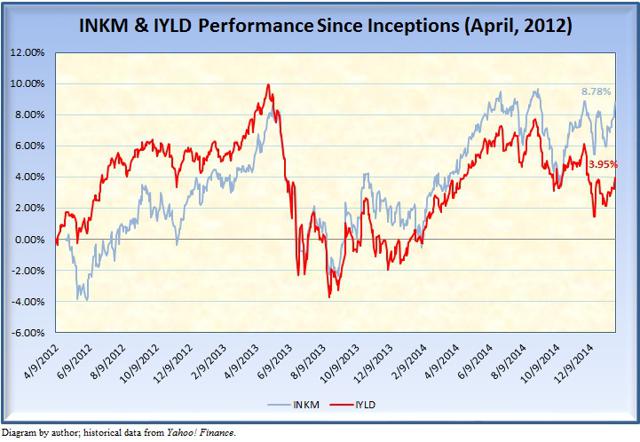
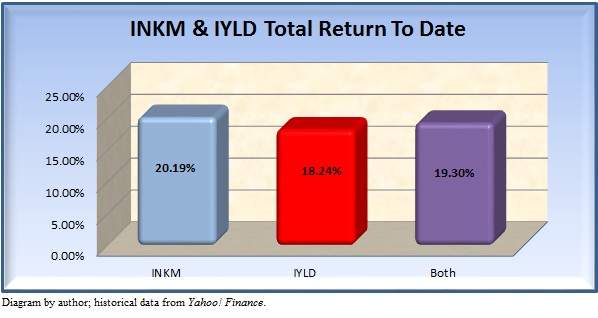

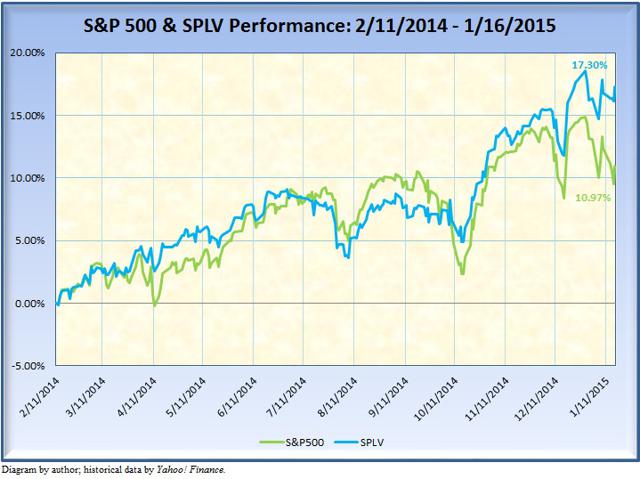
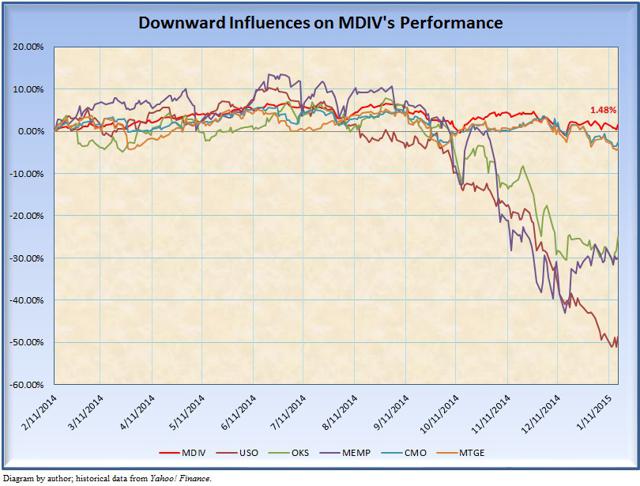
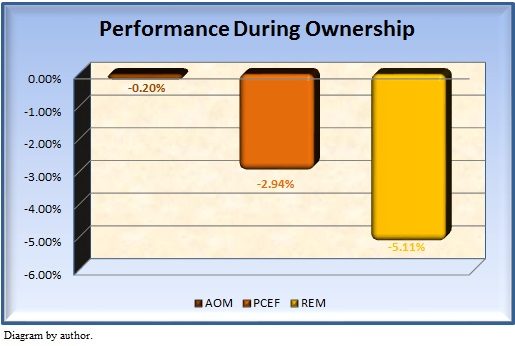
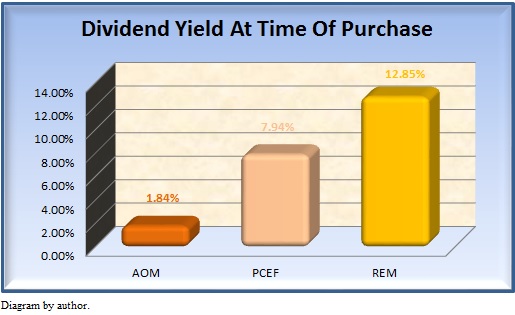
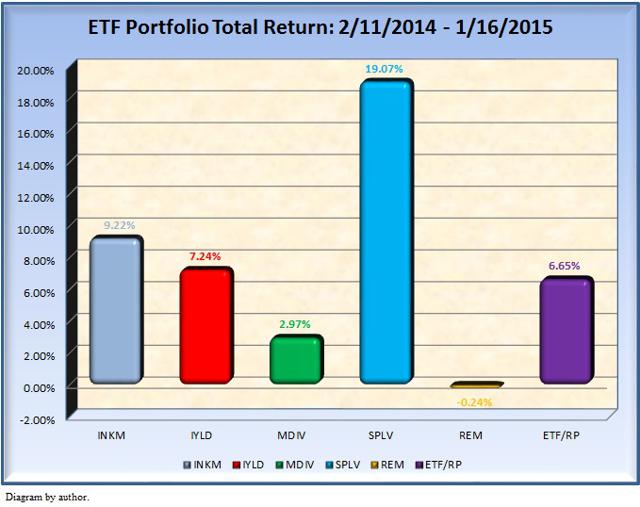
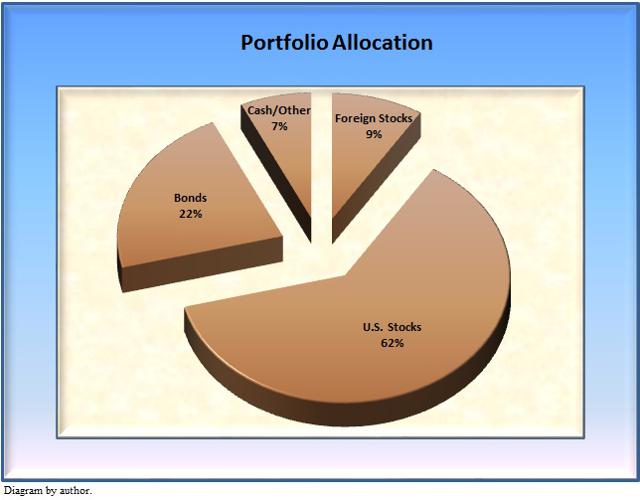 Summary After nearly its first full year, my ETF Retirement Portfolio is a qualified success; I continue to keep skin in the game. Most core holdings have performed very well. Some changes have been made to boost dividend yield and shore up the portfolio’s overall performance. In May, 2014, I presented a portfolio strategy that was intended to provide a solid core to a retirement portfolio 1 – I also have some skin in the game, having put a substantial part of my own portfolio in this strategy. After more than three quarters, the portfolio has gone through some changes: three of the original holdings are still in place, but there are now four ETFs, rather than the five I started with. For the time being, I see no substantive changes on the horizon, 2 so I wanted to update readers on the status of the portfolio (let’s call it ” ETF/RP “). The Philosophy Behind ETF/RP The retirement portfolio was considered (and constituted) after a particularly unhappy January in 2014, when I began wondering how I could position a large part of my investable funds so that I wouldn’t have to be overly concerned about how well those funds were doing. I dislike a formulaic approach to things – such as the “rule” about dividing one’s assets between a certain percentage of bonds and a certain percentage in equity, and so on 3 – so I wanted to try a way that would pay lip service to conventional wisdom while still sticking my neck out a little bit. By “retirement portfolio” I mean a portfolio for people who have already retired ; a portfolio designed to prepare for retirement should look a bit different, as the aims of the portfolio would be different (more towards capital growth, less towards income generation). The underlying aim of ETF/RP is capital preservation , which is perhaps the most important consideration for a retired investor. Retirees are not always in a position to make up for lost capital, so the risks taken have to be carefully evaluated with an eye to minimizing them. In addition, there were three things I sought from the portfolio: Modest growth potential; Potential for high dividend yield; Low maintenance. Seeking a high level of growth involves the assumption of higher levels of risk. The portfolio is thus not designed to generate growth in share value; rather, it is intended to secure as much capital as possible while offering the opportunity for growth. That growth may be modest , to be sure, but capital is in less danger of being lost. The highest dividend yields are going to involve the highest levels of risk; at the same time, yield is how the retiree acquires access to cash without selling shares. 4 The S&P 500 has an average dividend yield of 2.01%, 5 with the DJIA bringing in an average of 2.78%. 6 Prudent ETF choices can secure a higher yield, but – again – at higher risk. As for low maintenance, this is supposed to be for retirement. I want to do things other than managing my investments. 7 The goal at this point is to be able to leave the investments in place, thereby minimizing transaction costs; investors should feel confident that, but for the occasional flash crash or great recession, their investments are still at work making money. ETF/RP When I first began structuring the retirement portfolio it consisted of three ETFs: The SPDR Income Allocation ETF (NYSEARCA: INKM ) The iShares Morningstar Multi-Asset High Income Index ETF (BATS: IYLD ) The PowerShares S&P 500 Low Volatility Portfolio ETF (NYSEARCA: SPLV ) Gradually, two more ETFs were added to the collection: The iShares Moderate Allocation ETF (NYSEARCA: AOM ) The First Trust Multi-Asset Diversified Income Index ETF (NASDAQ: MDIV ) AOM quickly became the victim of less-than-enthusiastic performance, and was replaced by the PowerShares CEF Income Composite Portfolio ETF (NYSEARCA: PCEF ); PCEF itself recently became the victim to the same problem, and was replaced by the iShares Mortgage Real Estate Capped ETF (NYSEARCA: REM ). On 16 January, 2015, my shares MDIV were sold, the proceeds going to increase holdings in the other ETFs. The following chart reflects the performance of the portfolio (and each of its holdings) from inception (11 February, 2014) through 16 January, 2015. 8 (click to enlarge) INKM & IYLD As it turns out, INKM and IYLD are maybe the lynchpins of the portfolio, and they were chosen because they seemed to have just that kind of potential. The funds are structured alike, consisting of ETFs managed by their respective issuers, with attention paid to bonds (both corporate and government, U.S. and foreign) and stocks (U.S. and foreign, including emerging markets), as well as other instruments. 9 There are differences between the two, however, notably concerning their philosophies. INKM has a greater diversity of holdings than IYLD , and those holdings address capital stability; IYLD , on the other hand, places more emphasis on yield, it’s holdings consisting of instruments that produce more substantial income at some cost of increased risk. Both funds had their inceptions in April, 2012, so their performance has been in an environment dominated by quantitative easing. How these funds will perform now that easing has ended and interest-rate increases are on the horizon remains to be seen; to date, however, they have shown that they are not just “duplicate” funds. The following chart shows their performance since inception: (click to enlarge) INKM ‘s broader diversity has enabled it to provide significantly better performance than IYLD . At the same time, IYLD ‘s yield helps enable it to provide greater income, giving it a total return that helps make up most of the difference in performance: In a portfolio that seeks to provide both capital preservation and income generation, both ETFs fit the bill nicely – when working together. With INKM and IYLD , ETF/RP acquires exposure to bonds and other financial instruments, as well as accessing foreign markets. On a share-to-share basis, the funds combined to provide a dividend yield of 4.23% , and an appreciation in value of 6.49% for 2014. This strikes me as a solid foundation for an ETF-based retirement portfolio – both in concept and performance. SPLV I thought it important to have an element in the portfolio that would provide access to equities, and do so in a way that would hopefully minimize the influence market factors might have on the portfolio. This came with an acknowledgement that minimizing potential downward influence would also likely impact upward movement. There are several ETFs available that employ various “smart beta” strategies; my goal was to keep the portfolio simple, so I wanted the ETFs employed to be as basic as possible. SPLV is based on the S&P 500 – a solid foundation – and selects the 100 companies that have exhibited the least volatility for the past 12 months. The fund is reconstituted and rebalanced quarterly, which nominally boosts its expenses – note that its expense margin is lower than that of the other funds in ETF/RP – but, in return, one gets substantially better performance than is realized by the other ETFs. SPLV ‘s performance as part of ETF/RP is presented below: (click to enlarge) In the time that it has been in the portfolio, SPLV has outperformed the S&P 500 quite handily, although in historic measure, it is marginally lower than its “parent.” Close performance is all one can expect, however, and SPLV has so far provided more growth than I originally expected. MDIV At the time that I added MDIV to the ETF/RP I was looking for an ETF that would bolster the portfolio’s yield in a way that differed from that of IYLD . Where IYLD brought revenue from ETFs that managed high yield bonds and real estate, MDIV derived its revenue stream from direct investments in several areas that typically offer large dividends: MLPs, Utilities, Preferred Shares, REITs, and companies known for their generous dividends. Unfortunately, MDIV seemed to have difficulty getting off the ground, value-wise. Most important in its failure to perform was the one-two punch it took from a) the dramatic drop in oil prices, and b) the prospect of increasing interest rates. Although the fund has made some changes in its allocation since I bought it last year, it is still heavily weighted in REITs and MLPs. 10 Considered simply in terms of yield, MDIV may represent an interesting holding, as its yield is on a par with IYLD ; however, its status vis-à-vis capital preservation is less encouraging, and I do not expect its situation in this regard to change for the better any time soon. The following graph illustrates the influences that would seem to hamper MDIV ‘s progress: (click to enlarge) In the chart above, The United States Oil ETF LP (NYSEARCA: USO ) represents the extent of the drop in value oil’s recent plunge has caused; 11 MDIV components ONEOK Partners L.P. (NYSE: OKS ) and Memorial Production Partners L.P. (NASDAQ: MEMP ) have followed suit, as have others of MDIV ‘s MLP holdings. At the same time, REIT components focusing on mortgage-backed securities (i.e., mREITs) such as Capstead Mortgage Corp. (NYSE: CMO ) and American Capital Mortgage Investment Corp. (NASDAQ: MTGE ) are particularly sensitive to interest-rate pressures, and – with the prospect of an increase in interest rates by the Fed – have displayed some downward tendencies. 12 Whatever the outcome with respect to oil prices, it is unlikely that they will achieve levels seen before the recent drop anytime soon. This has raised various concerns about the sustainability of distributions to unit holders and the ability of indebted companies to make their interest payments. With Fed increases in interest rates almost a certainty by the end of the year (and possibly as early as June), there is room for concern that mREIT distributions and share value will also be hit. In light of the above, it strikes me as less than prudent to hold onto MDIV , at least as far as the ETF/RP is concerned. It looks to be very vulnerable to both a drop in share value (loss of capital) and a decrease in available distributions. It is possible to secure comparable yield from IYLD without the attendant prospect of loss of capital. It is also possible to secure larger yield than MDIV ‘s, albeit with continued risk to capital. It is a matter of weighing alternatives, and at this time MDIV does not seem to be a particularly good alternative. Thus, MDIV was dropped from the portfolio on 16 January, 2015, and no ETF was picked up to replace it. Instead, proceeds from the sale were used in increase shares in the other ETFs in the portfolio. REM In an article written in May, 2014, I discussed my reasons for replacing AOM with PCEF . 13 In the subsequent six months PCEF proceeded to drop by 2.94% – certainly offset by its dividends, but as with MDIV , it is possible to find higher-yielding ETFs. This is particularly true if one is resigned to suffering some loss of capital in the course of getting higher dividends. In November, 2014, I wrote an article examining both REM and the Market Vectors Mortgage REIT Income ETF (NYSEARCA: MORT ); 14 my examination satisfied me that REM was a reasonable fund to hold if one was looking for solid dividends and the prospect of share growth. In December I sold PCEF and replaced it with REM . I increased my position (as well as that of INKM , IYLD and SPLV ) when I sold MDIV . Selecting REM (particularly at the time when I did) brings with it the prospect of shaky capital preservation – at least until the nervousness about rate hikes diminishes. However, the performance reflected in the diagram above bought significant yield improvement: If I’m going to risk capital to secure dividend yield, I might as well get the highest yield I can reasonably get. 15 Moreover, REM has the advantage of being subject to only one primary risk factor (interest rates), while MDIV was subject to at least two major factors and PCEF was vulnerable to interest rates and the risk inherent in closed-end funds in general. REM thus seems the better opportunity – at least for the foreseeable future. Summary Clearly, in retrospect it would have been nice to have had all of ETF/RP invested in SPLV ; in the period from 11 February, 2014 through 16 January, 2015 that fund saw a total return of 19.07%. The portfolio did not do that badly, however: (click to enlarge) The combination of MDIV and the AOM / PCEF / REM position did hold down overall performance, but the “divestiture” of MDIV along with the introduction of REM ‘s high yield should bring about improved performance. 16 The portfolio is not quite one year old, and the next 12 months will no doubt see plenty of market vacillation – particularly as the Fed nears its first rate hike. I feel confident that the present allocation is well suited to current economic conditions. (click to enlarge) ” 5 ETFs For A Reliable Retirement Portfolio ,” Seeking Alpha , 6 May, 2014. Famous last words, no doubt. The formula would have me with 60% in bonds and 40% in equities, but (A) bonds have not been really “hot” of late, and I think the bull market still has some life left to it, even if it may be doddering its way into old age. Again, capital preservation: not only do we want not to lose any money, we don’t want to have to spend our capital, either. Through 31 December, 2014, according to the S&P 500 Fact Sheet available here . Updated 15 January, 2015, according to indexArb . So I spend much of my time sitting in front of a computer screen, researching investment material for articles, instead. A rather dramatic shift in ETF/RP ‘s performance in early May, and again in early November, reflects the redistribution of capital, as well as the infusion of accumulated dividends and extra cash. The infusion of capital was made to adjust the portfolio to reflect a market-value weighting schema. In the ETF tables that follow I present the expenses and investment income for each fund as reported in their most recent annual report. I also refer to the funds’ expense margin – a datum I develop and discuss in my article ” Ignore ETF Expense Ratios? Maybe .” Briefly stated, the expense margin identifies how much investment income a fund pays towards its expenses – it is, in a sense, a measure of a fund’s efficiency. MDIV may be examined at its homepage, here . Approximately 40% of its holdings are in REITs and MLPs, with another nearly 20% invested in the First Trust Tactical High Yield ETF (NASDAQ: HYLS ), which concentrates on high-yield corporate bonds. USO is presented for illustrative purposes, only. As of this writing, MDIV owns no shares of USO . Although these tendencies are – at least for now – apparently temporary. Whether they will reassert downward pressure once the Fed increases rates later this year (which seems evermore likely) remains to be seen. Downward pressure also seems to be coming from mortgage rates, which have been dropping slightly at this writing. ” Adjusting the ETF Retirement Portfolio ,” Seeking Alpha , 21 May, 2014. ” REM And MORT: Mortgage REIT ETFs For Growth And Yield ,” Seeking Alpha , 5 November, 2014. To be sure, there are (a few) ETFs that pay more dividends than REM , but – at least, to my estimation – the risk involved is more than I am willing to take. The total return of -0.24% attributed to REM reflects only the fund’s own -5.11% performance over less than two months, offset by a single quarterly dividend payment received in December. It was on the basis of that that I decided to drop MDIV . REM ‘s performance has been generally upwards the past two weeks. Scalper1 News
Scalper1 News