Tag Archives: united-states

Divergence Of Oil And Gas Prices Offers Golden Pair Trade Opportunity

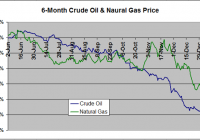
Summary Natural gas has slumped 33% over the last six months, but crude oil has fallen further, by 53%. As a result , the oil-gas ratio has tumbled 40% to 15.5, in the 4th percentile over the last five years. Theoretically, as gas becomes relatively more expensive to oil, drilling should shift away from oil and even into gas, if prices remain competitive, resulting in a normalization of the ratio. A long USO, short UNG pair trade will capitalize on this ratio returning to historical levels without net exposure to the tenuous commodity sector as a whole. Should the ratio return to its five year average of 25, a long USO/short UNG trade will net approximately 23%. A leveraged long UWTI/short UGAZ trade will yield approximately 70%. Investing in natural gas has been a challenge over the last year. After spiking to multi-year highs last winter thanks to the coldest winter in the past 20 years, the price of the commodity has been decimated over the past six months due to a combination of a mild summer and autumn that suppressed demand and record production. At Friday’s closing price of $3.12/MMBTU, the commodity is down 32.5% since June 1, 2014. As hard as it’s been to be a bull in the natural gas space, crude oil traders have an ever rougher deal. Thanks to record-setting U.S. production and OPEC willing to play a dangerous game of chicken with U.S. producers, the normally less-volatile crude oil is down 52.5% during the same period. Figure 1 below compares oil and natural gas prices over the last six months. (click to enlarge) Figure 1: 6-Month Oil/Gas Price Change (Pricing Data Sources EIA: NYMEX Futures Prices & Natural Gas Futures ) Depending on what source you read, oil is bound for either a rapid bounce to $60/barrel or doomed to slog around at $40/barrel for the next year or two. Likewise, for every article dooming natural gas to $2.00/MMBTU for the foreseeable future, another is predicting a new polar vortex that will send price soaring back to $4.00/MMBTU. Admittedly, there is an abnormally large degree of uncertainty in both sectors. Instead of trying to predict price movements in either commodity, this article will discuss a strategy to capitalize on a divergence from the historical relationship between the price of natural gas and oil. While natural gas has had a poor six-month performance, it is crude oil that has really been taken to the cleaners. As a result, natural gas has become more expensive relative to crude oil. Figure 2 below shows the Crude Oil-to-Natural Gas ratio over the last six years dating back to 2008. (click to enlarge) Figure 2: Oil-To-Gas Ratio 2008-Present (Source as above) The first half of 2008 marked the end of the era of vertical well drilling. In 2009 and beyond, directional drilling and fracking technology made the cost of hydrocarbon production significantly cheaper. However, the technology disproportionately benefited natural gas drillers. The crude oil-to-natural gas ratio therefore ballooned from around 12 in 2008 to a peak of 50 in early 2012 as natural gas prices plummeted to briefly under $2.00/MMBTU and oil prices stabilized around $100/barrel. The ratio has generally oscillated between 20 and 30 thereafter. However, as oil prices have tanked much faster than natural gas over the last six months, the ratio has plummeted over 40% from 27 in mid-July 2014 to 15.5 as of Friday’s close. This represents the 25th percentile since 2008 and the 4th percentile since 2010-the rough start of the fracking era. Rather than betting on a recovery in either natural gas or oil prices, an alternative strategy is a pair trade that bets on the recovery of this ratio to the historical range. This entails taking a short position in a natural gas ETF such as the United States Natural Gas ETF (NYSEARCA: UNG ) and a long position in an oil ETF such as the United States Oil ETF (NYSEARCA: USO ) such that a recovery in the crude oil-to-natural gas ratio will result in a net profitable position. If natural gas slumps and oil rallies-resulting in a rapid recovery in the ratio-both positions profit. If both natural gas and oil rally, but oil rallies more-resulting in a slower recovery in the ratio-the profits from the long oil position will outweigh the losses from the natural gas short. Likewise, should both fall but natural gas fall faster, the opposite will be true-profits from the natural gas short will outweigh losses from the oil long. Of course, should natural gas outperform oil, the pair trade will be a losing one-and because there is a short position involved, the losses may be extensive. However, this will result in the crude oil-to-natural gas ratio falling towards 10 and deviating even further from the historical averages. Approximate returns of this trade going long USO and short UNG are shown below in Figure 3 based on crude oil-to-natural gas ratio. I say “approximate” because the exact profitability varies slightly depending the exact prices of the two commodities (i.e. Oil at $60 and Gas at $3 vs. Oil at $40 and Gas at $2, both for a ratio of 20). These calculations assume a price of crude at $60/barrel, which represents the median of current analyst estimates for a 6 month price target, and natural gas at the corresponding value to satisfy the given ratio. Of note, real world returns may actually be boosted compared to these projections. It is well-established that rollover losses from contango can decimate an ETF. This is something that has plagued natural gas ETFs given the frequency at which this commodity trades with a large contango. Oil traditionally trades at a much smaller contango. Thus “excess” profits in the UNG short due to contango not affiliated with organic price movements will likely outweigh much smaller “excess” losses in the USO long due to contango. (click to enlarge) Figure 3: Projected profitability of a Long USO/Short UNG Pair Trade depending on Oil/Gas Ratio Should the ratio bounce just 30% to 20, the trade will return 14%. Should the ratio return to its 5-year historical average of 25, the trade returns 23%. I am currently invested in this trade using a position size that comprises 15% of my portfolio. Should the ratio slump under 15, I will look to slowly add to my positions. These returns can be boosted by using leveraged ETFs. Figure 4 below shows the same curve using a long Velocity Shares 3x Crude Oil ETN (NYSEARCA: UWTI ) and short Velocity Shares 3x Natural Gas ETN (NYSEARCA: UGAZ ) pair trade. (click to enlarge) Figure 4: Projected profitability of a Long UWTI/Short UGAZ Pair Trade depending on Oil/Gas Ratio Using this trade, profits will be around 41% should the ratio recover to 20 and 70% should the ratio climb to 25. However, this trade is not without risk. The excess leverage boosts losses such that should the crude oil-to-natural gas ratio fall to 10, losses will comprise the entire position due to the ballooning value of the short UGAZ short position. Secondly, the leveraged ETFs are not designed to track their underlying commodities in the long term. These ETFs tend to underperform, particularly in a choppy trade environment. Thus, should it take the oil-to-gas ratio > 6 months to reach a target level, expect actual returns to be less than projected. Beyond simple technicals-oil is due for a bounce after a nearly linear 6-month decline-the fundamental rational behind this trade is simple. As natural gas becomes more expensive relative to crude oil, it becomes less and less profitable to drill for liquid hydrocarbons versus gaseous hydrocarbons and rigs are gradually shunted from oil-directed to gas-directed. This trend is already reflected in the Baker Hughes Rig count. Figure 5 below shows the % change in oil-directed and gas-directed rigs over the past 6-months. (click to enlarge) Figure 5: Baker Hughes Rig Count Change In Oil And Gas Rigs Over The Last Six Months (Source: Baker Hughes ) Natural Gas-directed rigs have fallen 4.9% to 310 as of last Friday while Crude Oil rigs have fallen by 11.0% to 1366, or by 170 oil rigs and 16 gas rigs. Should this trend continue, it is likely that the crude oil supply will gradually stabilize while natural gas supply is more likely to remain near record levels, increasing the odds that the oil-to-gas ratio normalizes to historical levels. Additional disclosure: The author is also short UNG as discussed in the article.
If You Think You Are Buying Into Oil, Think Again!

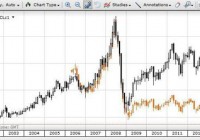
Summary Difficulty in finding a spot oil exposure in the market. USO ETF does not mirror oil price movements perfectly. Long dated oil futures might provide better exposure. There is a lot of hype now looking at oil given the large volatile swings in oil price and its overall drastic decline since about a year ago. For savvy investors, this article would probably not be very relevant because you might already know this. Retail investors who read about oil prices in the news and are very new to this should however, take a closer look. The average investor would probably think of going long or short oil via exchange traded funds, namely the United States Oil Fund or USO. Some information on USO ( website ) As of Jan. 13, 2015 Market Capitalization : 1,688 million Assets Under Management: 1,667 million Management Fee: 0.45% Total Expense Ratio: 0.76% (from 9.30.2014 fund update ) According to the USO website, USO is “designed to track the daily price movements of the West Texas Intermediate (“WTI”) light, sweet crude oil”. For retail investors, this is generally a liquid counter with an average of 16.7 million shares traded daily in the past 3 months. Notably, trading volumes seems to have picked up recently perhaps because of the coverage of oil prices in the news lately. As of Jan 13, the daily volume was 33 million shares traded. Caution is Advised If an investor wants to get exposure to Spot Oil prices without renting a vessel to physically store oil, the investor may have a wrong impression that a good way would be to buy or sell the USO ETF units. Here’s why this is quite ill advised. (click to enlarge) Plotting a chart of the USO ETF with the continuous CLc1 NYMEX prices shows a very obvious trend. In 2009, WTI prices rose from $40 to $80 in a year’s time. During the same period, USO ran up from $29 to $39. A very striking difference in the return profile for an investor who wishes to invest in spot oil prices but ends up buying something different. As prices collapsed in the middle of 2014, from about $100 to right now hitting $45, the USO declined from $37 to about $18. This is also slightly less than the CLc1 movement. For those interested in some numbers, I have extracted out the month-end closing prices of both the USO and the CLc1 in the table below. Month USO CLC1 (spot) USO +/- % CLC1 +/- % Jan-09 29.22 41.75 Feb-09 27.03 44.12 -7.49% 5.68% Mar-09 29.05 48.85 7.47% 10.72% Apr-09 28.63 50.88 -1.45% 4.16% May-09 36.41 66.95 27.17% 31.58% Jun-09 37.93 70.6 4.17% 5.45% Jul-09 36.81 69.5 -2.95% -1.56% Aug-09 36.05 69.57 -2.06% 0.10% Sep-09 36.19 70.4 0.39% 1.19% Oct-09 39.31 76.99 8.62% 9.36% Nov-09 39.16 76.42 -0.38% -0.74% Dec-09 39.28 79.62 0.31% 4.19% Jan-10 35.64 72.64 -9.27% -8.77% Feb-10 38.82 79.61 8.92% 9.60% Mar-10 40.3 83.38 3.81% 4.74% Apr-10 41.33 86.22 2.56% 3.41% May-10 34.05 74.09 -17.61% -14.07% Jun-10 33.96 75.37 -0.26% 1.73% Jul-10 35.34 78.99 4.06% 4.80% Aug-10 31.91 71.68 -9.71% -9.25% Sep-10 34.84 79.81 9.18% 11.34% Oct-10 35.14 81.92 0.86% 2.64% Nov-10 36.04 83.59 2.56% 2.04% Dec-10 39 91.4 8.21% 9.34% Jan-11 38.61 92.22 -1.00% 0.90% Feb-11 39.19 96.87 1.50% 5.04% Mar-11 42.58 106.79 8.65% 10.24% Apr-11 45.15 113.42 6.04% 6.21% May-11 40.5 102.59 -10.30% -9.55% Jun-11 37.26 95.12 -8.00% -7.28% Jul-11 37.43 95.86 0.46% 0.78% Aug-11 34.51 88.72 -7.80% -7.45% Sep-11 30.5 78.75 -11.62% -11.24% Oct-11 35.74 92.58 17.18% 17.56% Nov-11 38.78 100.5 8.51% 8.55% Dec-11 38.11 99.06 -1.73% -1.43% Jan-12 37.82 98.28 -0.76% -0.79% Feb-12 40.92 106.91 8.20% 8.78% Mar-12 39.23 102.93 -4.13% -3.72% Apr-12 39.68 104.89 1.15% 1.90% May-12 32.61 86.5 -17.82% -17.53% Jun-12 31.82 84.84 -2.42% -1.92% Jul-12 32.68 87.96 2.70% 3.68% Aug-12 35.89 96.56 9.82% 9.78% Sep-12 34.13 92.1 -4.90% -4.62% Oct-12 31.78 86.01 -6.89% -6.61% Nov-12 32.56 88.94 2.45% 3.41% Dec-12 33.36 91.79 2.46% 3.20% Jan-13 35.28 97.41 5.76% 6.12% Feb-13 33.06 91.83 -6.29% -5.73% Mar-13 34.76 97.28 5.14% 5.93% Apr-13 33.16 93.32 -4.60% -4.07% May-13 32.61 91.61 -1.66% -1.83% Jun-13 34.15 96.49 4.72% 5.33% Jul-13 37.36 105.32 9.40% 9.15% Aug-13 38.48 107.76 3.00% 2.32% Sep-13 36.85 102.29 -4.24% -5.08% Oct-13 34.69 96.24 -5.86% -5.91% Nov-13 33.46 92.78 -3.55% -3.60% Dec-13 35.32 98.7 5.56% 6.38% Jan-14 34.8 97.46 -1.47% -1.26% Feb-14 36.74 102.76 5.57% 5.44% Mar-14 36.59 101.56 -0.41% -1.17% Apr-14 36.32 99.68 -0.74% -1.85% May-14 37.68 102.93 3.74% 3.26% Jun-14 38.88 105.51 3.18% 2.51% Jul-14 36.31 97.65 -6.61% -7.45% Aug-14 35.76 95.84 -1.51% -1.85% Sep-14 34.43 91.32 -3.72% -4.72% Oct-14 30.63 80.7 -11.04% -11.63% Nov-14 25.58 65.99 -16.49% -18.23% Dec-14 20.36 53.71 -20.41% -18.61% Slight percentage variations in price movements can mean quite a lot to investors. Hence, it is better to understand why this occurs before making a decision to invest. Oil futures are currently in a contango, which basically means oil prices in the future, are worth more than the current price. This usually reflects some cost of handling and storage and cost of carry. (click to enlarge) Looking at the difference between a Dec 2015 futures price of $53.32 versus the front month futures price of $45.99, it may be easy for anyone to simplistically try to mirror a hedge strategy by trying to buy the USO and selling the Dec 2015 futures. The problem lies with how the USO is priced. Here is a snapshot of what the USO holds in its Net Asset Value disclosed: (click to enlarge) (click to enlarge) As shown above, as time progresses, the fund rolls over its holdings from the current front month futures (e.g. Feb 15 futures) into the next month (Mar 15 futures). In the process of rolling over its holdings, it sells the Feb 15 futures and buys the Mar 15 futures, hence incurring the differential cost or spread between the Feb and Mar products. In the USO prospectus page 18, this phenomenon is explained and illustrated in the example quoted below. “If the futures market is in contango, the investor would be buying a next month contract for a higher price than the current near month contract. Using again the $50 per barrel price above to represent the front month price, the price of the next month contract could be $51 per barrel, that is, 2% more expensive than the front month contract. Hypothetically, and assuming no other changes to either prevailing crude oil prices or the price relationship between the spot price, the near month contract and the next month contract (and ignoring the impact of commission costs and the income earned on cash and/or cash equivalents), the value of the next month contract would fall as it approaches expiration and becomes the new near month contract with a price of $50. In this example, it would mean that the value of an investment in the second month would tend to rise slower than the spot price of crude oil, or fall faster. As a result, it would be possible in this hypothetical example for the spot price of crude oil to have risen 10% after some period of time, while the value of the investment in the second month futures contract will have risen only 8%, assuming contango is large enough or enough time has elapsed. Similarly, the spot price of crude oil could have fallen 10% while the value of an investment in the second month futures contract could have fallen 12%. Over time, if contango remained constant, the difference would continue to increase.” Conclusion I hope I have driven the point across on the USO ETF, that it is a means to get exposure to oil price movements, but it is nowhere near a perfectly correlated product.

UNG Remains Around $15 – Will It Recover?

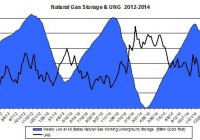
Summary The natural gas storage is projected to be lower than normal by the end of March. The short-term weather outlook is uncertain, but suggests warmer-than-normal weather, which could bring UNG back down. The extraction from storage is expected to be lower than normal this week. The price of The United States Natural Gas ETF (NYSEARCA: UNG ) ended the year with another tumble, as it dipped below $15 at one point. Currently, the price is around $15 – the lowest level UNG reached in the past couple of years. The high uncertainty around the weather forecasts for January didn’t stop investors from pulling out of UNG. The hotter-than-normal weather and slow rise in production maintains UNG at its current low level. Keep in mind, however, the natural gas storage is still low for the season, and is likely to remain low by the end of March. Storage extractions remain slow The last few storage reports showed that the extractions were very low for this time of the year. We could start seeing a trend developing in recent weeks. The chart below presents the changes in the natural gas underground storage and the price of UNG in the past couple of years. (Data Source: EIA, Google Finance) As you can see, the slope in storage this winter seems less steep than in previous winters. This could indicate that the natural gas market doesn’t heat up as it did last winter. The natural gas futures markets also show a trend – the once-high Backwardation for the four-month contracts recorded at the end of November has almost entirely dissipated. Currently, the future markets are mostly still in Backwardation, however, the gaps are very small. (Data Source: EIA) So the markets still expect a modest gain, at best, in the price of natural gas in the near term. After all, the EIA still expects the spot price to average at $4 during January. Long-time investors in natural gas know that this market view could change very promptly if the weather conditions change or any other unexpected event were to come to fruition. Looking forward, the EIA projects inventories will reach to 1,431 Bcf by the end of the extraction season (the end of March), which is still 225 Bcf below the 5-year average. Some analysts still expect the storage levels will rise to 4,000 Bcf by the end of the year – I remain skeptical about this outlook. Next week’s extraction from storage is likely to be lower than normal again, because last week’s deviation from normal temperatures was, on average, 7.12. This measurement tends to have a strong positive correlation (0.62) with the changes in the gap between the 5-year average extraction and current extraction. Another issue to consider is the ongoing growing natural gas production – current estimates are for a 3.1% gain in output in 2015, year over year. This growth rate will be slower than in 2014, but will still reduce the pressure on UNG prices. The rise in production continues, albeit the number of rigs remains low: Based on the recent update from Baker Hughes , the natural gas rotary rig count rose by 2 rigs to reach 340 rigs – nearly 9% below the levels recorded back in 2013. The drop in natural gas prices also had an adverse impact on natural gas producers such as Chesapeake Energy (NYSE: CHK ) – the company’s stock dropped by 11% during the past couple of months. For Chesapeake Energy, the plunge in oil prices also took its toll on its stock in recent weeks. Over the next two weeks, temperatures are expected to be above normal in the west and normal in other parts of the U.S., including the Northeast and the Midwest. Based on the National Oceanic and Atmospheric Administration , January’s weather remains highly uncertain, however. By the middle of January, the NOAA projects higher-than-normal temperatures in many parts of the U.S., including the West and the Northeast. NOAA also estimates below-normal temperatures in some regions, such as central and southern Great Plains. The hotter-than-normal weather and the slow extraction from storage are keeping UNG down. But the natural gas market won’t need much to drive UNG back up, including sharp changes in weather, a slowdown in output or a rise in the pace of depletion. For more see: ” Is Chesapeake Regaining Our Confidence? ”