Scalper1 News
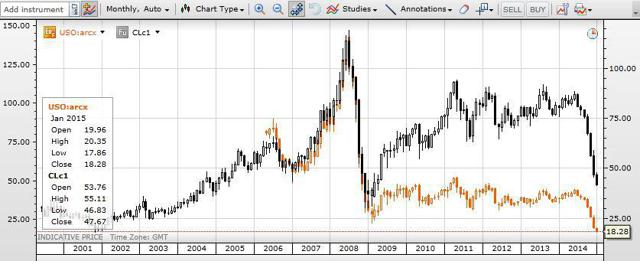
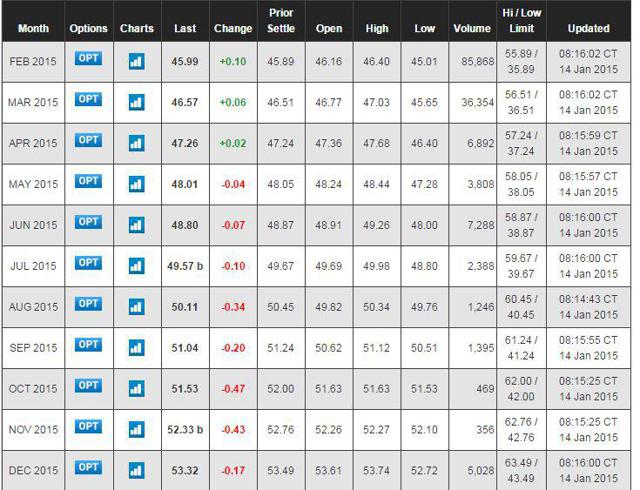
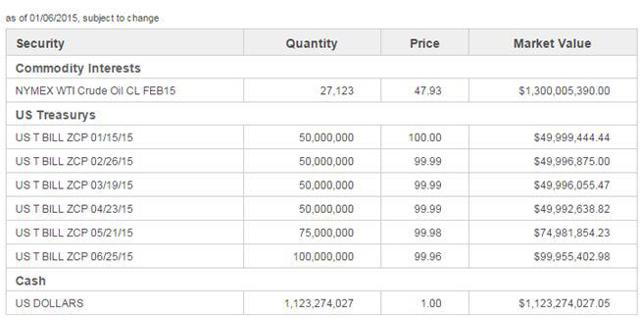
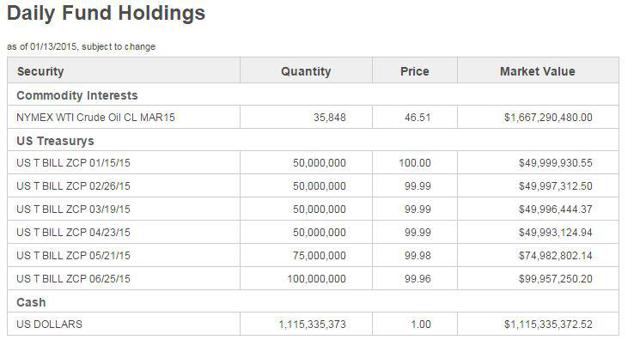 Summary Difficulty in finding a spot oil exposure in the market. USO ETF does not mirror oil price movements perfectly. Long dated oil futures might provide better exposure. There is a lot of hype now looking at oil given the large volatile swings in oil price and its overall drastic decline since about a year ago. For savvy investors, this article would probably not be very relevant because you might already know this. Retail investors who read about oil prices in the news and are very new to this should however, take a closer look. The average investor would probably think of going long or short oil via exchange traded funds, namely the United States Oil Fund or USO. Some information on USO ( website ) As of Jan. 13, 2015 Market Capitalization : 1,688 million Assets Under Management: 1,667 million Management Fee: 0.45% Total Expense Ratio: 0.76% (from 9.30.2014 fund update ) According to the USO website, USO is “designed to track the daily price movements of the West Texas Intermediate (“WTI”) light, sweet crude oil”. For retail investors, this is generally a liquid counter with an average of 16.7 million shares traded daily in the past 3 months. Notably, trading volumes seems to have picked up recently perhaps because of the coverage of oil prices in the news lately. As of Jan 13, the daily volume was 33 million shares traded. Caution is Advised If an investor wants to get exposure to Spot Oil prices without renting a vessel to physically store oil, the investor may have a wrong impression that a good way would be to buy or sell the USO ETF units. Here’s why this is quite ill advised. (click to enlarge) Plotting a chart of the USO ETF with the continuous CLc1 NYMEX prices shows a very obvious trend. In 2009, WTI prices rose from $40 to $80 in a year’s time. During the same period, USO ran up from $29 to $39. A very striking difference in the return profile for an investor who wishes to invest in spot oil prices but ends up buying something different. As prices collapsed in the middle of 2014, from about $100 to right now hitting $45, the USO declined from $37 to about $18. This is also slightly less than the CLc1 movement. For those interested in some numbers, I have extracted out the month-end closing prices of both the USO and the CLc1 in the table below. Month USO CLC1 (spot) USO +/- % CLC1 +/- % Jan-09 29.22 41.75 Feb-09 27.03 44.12 -7.49% 5.68% Mar-09 29.05 48.85 7.47% 10.72% Apr-09 28.63 50.88 -1.45% 4.16% May-09 36.41 66.95 27.17% 31.58% Jun-09 37.93 70.6 4.17% 5.45% Jul-09 36.81 69.5 -2.95% -1.56% Aug-09 36.05 69.57 -2.06% 0.10% Sep-09 36.19 70.4 0.39% 1.19% Oct-09 39.31 76.99 8.62% 9.36% Nov-09 39.16 76.42 -0.38% -0.74% Dec-09 39.28 79.62 0.31% 4.19% Jan-10 35.64 72.64 -9.27% -8.77% Feb-10 38.82 79.61 8.92% 9.60% Mar-10 40.3 83.38 3.81% 4.74% Apr-10 41.33 86.22 2.56% 3.41% May-10 34.05 74.09 -17.61% -14.07% Jun-10 33.96 75.37 -0.26% 1.73% Jul-10 35.34 78.99 4.06% 4.80% Aug-10 31.91 71.68 -9.71% -9.25% Sep-10 34.84 79.81 9.18% 11.34% Oct-10 35.14 81.92 0.86% 2.64% Nov-10 36.04 83.59 2.56% 2.04% Dec-10 39 91.4 8.21% 9.34% Jan-11 38.61 92.22 -1.00% 0.90% Feb-11 39.19 96.87 1.50% 5.04% Mar-11 42.58 106.79 8.65% 10.24% Apr-11 45.15 113.42 6.04% 6.21% May-11 40.5 102.59 -10.30% -9.55% Jun-11 37.26 95.12 -8.00% -7.28% Jul-11 37.43 95.86 0.46% 0.78% Aug-11 34.51 88.72 -7.80% -7.45% Sep-11 30.5 78.75 -11.62% -11.24% Oct-11 35.74 92.58 17.18% 17.56% Nov-11 38.78 100.5 8.51% 8.55% Dec-11 38.11 99.06 -1.73% -1.43% Jan-12 37.82 98.28 -0.76% -0.79% Feb-12 40.92 106.91 8.20% 8.78% Mar-12 39.23 102.93 -4.13% -3.72% Apr-12 39.68 104.89 1.15% 1.90% May-12 32.61 86.5 -17.82% -17.53% Jun-12 31.82 84.84 -2.42% -1.92% Jul-12 32.68 87.96 2.70% 3.68% Aug-12 35.89 96.56 9.82% 9.78% Sep-12 34.13 92.1 -4.90% -4.62% Oct-12 31.78 86.01 -6.89% -6.61% Nov-12 32.56 88.94 2.45% 3.41% Dec-12 33.36 91.79 2.46% 3.20% Jan-13 35.28 97.41 5.76% 6.12% Feb-13 33.06 91.83 -6.29% -5.73% Mar-13 34.76 97.28 5.14% 5.93% Apr-13 33.16 93.32 -4.60% -4.07% May-13 32.61 91.61 -1.66% -1.83% Jun-13 34.15 96.49 4.72% 5.33% Jul-13 37.36 105.32 9.40% 9.15% Aug-13 38.48 107.76 3.00% 2.32% Sep-13 36.85 102.29 -4.24% -5.08% Oct-13 34.69 96.24 -5.86% -5.91% Nov-13 33.46 92.78 -3.55% -3.60% Dec-13 35.32 98.7 5.56% 6.38% Jan-14 34.8 97.46 -1.47% -1.26% Feb-14 36.74 102.76 5.57% 5.44% Mar-14 36.59 101.56 -0.41% -1.17% Apr-14 36.32 99.68 -0.74% -1.85% May-14 37.68 102.93 3.74% 3.26% Jun-14 38.88 105.51 3.18% 2.51% Jul-14 36.31 97.65 -6.61% -7.45% Aug-14 35.76 95.84 -1.51% -1.85% Sep-14 34.43 91.32 -3.72% -4.72% Oct-14 30.63 80.7 -11.04% -11.63% Nov-14 25.58 65.99 -16.49% -18.23% Dec-14 20.36 53.71 -20.41% -18.61% Slight percentage variations in price movements can mean quite a lot to investors. Hence, it is better to understand why this occurs before making a decision to invest. Oil futures are currently in a contango, which basically means oil prices in the future, are worth more than the current price. This usually reflects some cost of handling and storage and cost of carry. (click to enlarge) Looking at the difference between a Dec 2015 futures price of $53.32 versus the front month futures price of $45.99, it may be easy for anyone to simplistically try to mirror a hedge strategy by trying to buy the USO and selling the Dec 2015 futures. The problem lies with how the USO is priced. Here is a snapshot of what the USO holds in its Net Asset Value disclosed: (click to enlarge) (click to enlarge) As shown above, as time progresses, the fund rolls over its holdings from the current front month futures (e.g. Feb 15 futures) into the next month (Mar 15 futures). In the process of rolling over its holdings, it sells the Feb 15 futures and buys the Mar 15 futures, hence incurring the differential cost or spread between the Feb and Mar products. In the USO prospectus page 18, this phenomenon is explained and illustrated in the example quoted below. “If the futures market is in contango, the investor would be buying a next month contract for a higher price than the current near month contract. Using again the $50 per barrel price above to represent the front month price, the price of the next month contract could be $51 per barrel, that is, 2% more expensive than the front month contract. Hypothetically, and assuming no other changes to either prevailing crude oil prices or the price relationship between the spot price, the near month contract and the next month contract (and ignoring the impact of commission costs and the income earned on cash and/or cash equivalents), the value of the next month contract would fall as it approaches expiration and becomes the new near month contract with a price of $50. In this example, it would mean that the value of an investment in the second month would tend to rise slower than the spot price of crude oil, or fall faster. As a result, it would be possible in this hypothetical example for the spot price of crude oil to have risen 10% after some period of time, while the value of the investment in the second month futures contract will have risen only 8%, assuming contango is large enough or enough time has elapsed. Similarly, the spot price of crude oil could have fallen 10% while the value of an investment in the second month futures contract could have fallen 12%. Over time, if contango remained constant, the difference would continue to increase.” Conclusion I hope I have driven the point across on the USO ETF, that it is a means to get exposure to oil price movements, but it is nowhere near a perfectly correlated product. Scalper1 News
Scalper1 News