Scalper1 News
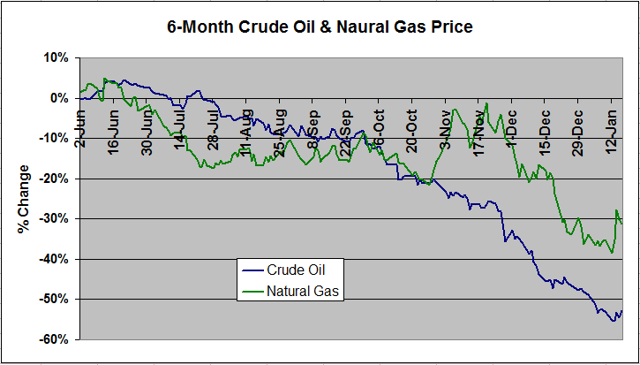
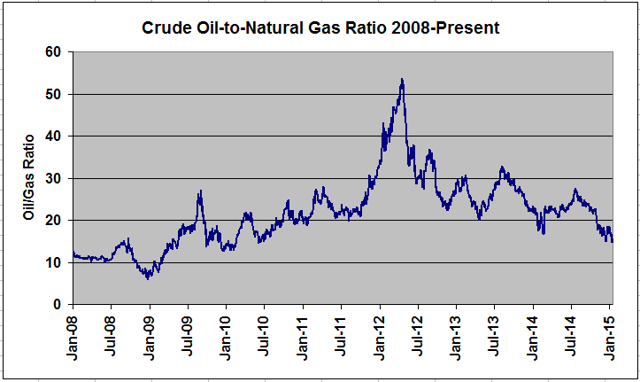
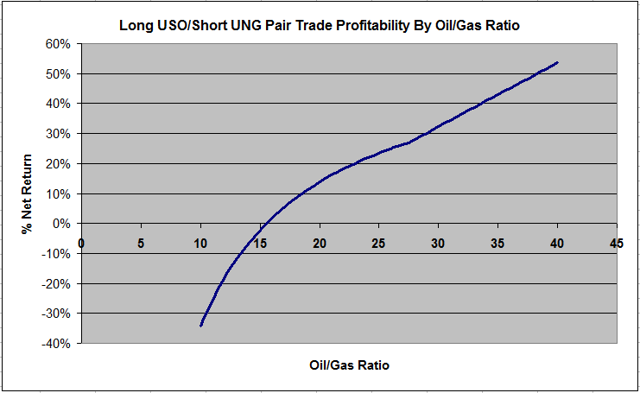
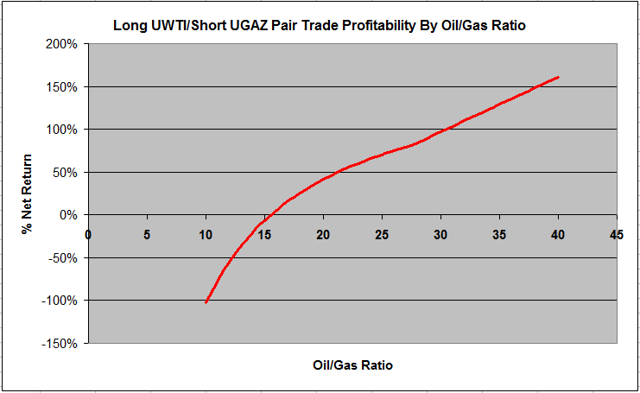
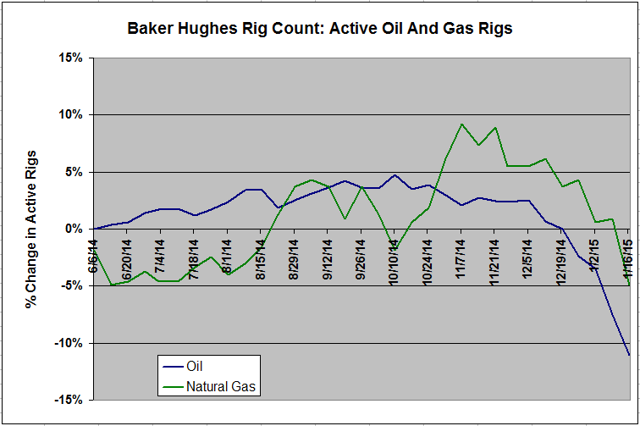 Summary Natural gas has slumped 33% over the last six months, but crude oil has fallen further, by 53%. As a result , the oil-gas ratio has tumbled 40% to 15.5, in the 4th percentile over the last five years. Theoretically, as gas becomes relatively more expensive to oil, drilling should shift away from oil and even into gas, if prices remain competitive, resulting in a normalization of the ratio. A long USO, short UNG pair trade will capitalize on this ratio returning to historical levels without net exposure to the tenuous commodity sector as a whole. Should the ratio return to its five year average of 25, a long USO/short UNG trade will net approximately 23%. A leveraged long UWTI/short UGAZ trade will yield approximately 70%. Investing in natural gas has been a challenge over the last year. After spiking to multi-year highs last winter thanks to the coldest winter in the past 20 years, the price of the commodity has been decimated over the past six months due to a combination of a mild summer and autumn that suppressed demand and record production. At Friday’s closing price of $3.12/MMBTU, the commodity is down 32.5% since June 1, 2014. As hard as it’s been to be a bull in the natural gas space, crude oil traders have an ever rougher deal. Thanks to record-setting U.S. production and OPEC willing to play a dangerous game of chicken with U.S. producers, the normally less-volatile crude oil is down 52.5% during the same period. Figure 1 below compares oil and natural gas prices over the last six months. (click to enlarge) Figure 1: 6-Month Oil/Gas Price Change (Pricing Data Sources EIA: NYMEX Futures Prices & Natural Gas Futures ) Depending on what source you read, oil is bound for either a rapid bounce to $60/barrel or doomed to slog around at $40/barrel for the next year or two. Likewise, for every article dooming natural gas to $2.00/MMBTU for the foreseeable future, another is predicting a new polar vortex that will send price soaring back to $4.00/MMBTU. Admittedly, there is an abnormally large degree of uncertainty in both sectors. Instead of trying to predict price movements in either commodity, this article will discuss a strategy to capitalize on a divergence from the historical relationship between the price of natural gas and oil. While natural gas has had a poor six-month performance, it is crude oil that has really been taken to the cleaners. As a result, natural gas has become more expensive relative to crude oil. Figure 2 below shows the Crude Oil-to-Natural Gas ratio over the last six years dating back to 2008. (click to enlarge) Figure 2: Oil-To-Gas Ratio 2008-Present (Source as above) The first half of 2008 marked the end of the era of vertical well drilling. In 2009 and beyond, directional drilling and fracking technology made the cost of hydrocarbon production significantly cheaper. However, the technology disproportionately benefited natural gas drillers. The crude oil-to-natural gas ratio therefore ballooned from around 12 in 2008 to a peak of 50 in early 2012 as natural gas prices plummeted to briefly under $2.00/MMBTU and oil prices stabilized around $100/barrel. The ratio has generally oscillated between 20 and 30 thereafter. However, as oil prices have tanked much faster than natural gas over the last six months, the ratio has plummeted over 40% from 27 in mid-July 2014 to 15.5 as of Friday’s close. This represents the 25th percentile since 2008 and the 4th percentile since 2010-the rough start of the fracking era. Rather than betting on a recovery in either natural gas or oil prices, an alternative strategy is a pair trade that bets on the recovery of this ratio to the historical range. This entails taking a short position in a natural gas ETF such as the United States Natural Gas ETF (NYSEARCA: UNG ) and a long position in an oil ETF such as the United States Oil ETF (NYSEARCA: USO ) such that a recovery in the crude oil-to-natural gas ratio will result in a net profitable position. If natural gas slumps and oil rallies-resulting in a rapid recovery in the ratio-both positions profit. If both natural gas and oil rally, but oil rallies more-resulting in a slower recovery in the ratio-the profits from the long oil position will outweigh the losses from the natural gas short. Likewise, should both fall but natural gas fall faster, the opposite will be true-profits from the natural gas short will outweigh losses from the oil long. Of course, should natural gas outperform oil, the pair trade will be a losing one-and because there is a short position involved, the losses may be extensive. However, this will result in the crude oil-to-natural gas ratio falling towards 10 and deviating even further from the historical averages. Approximate returns of this trade going long USO and short UNG are shown below in Figure 3 based on crude oil-to-natural gas ratio. I say “approximate” because the exact profitability varies slightly depending the exact prices of the two commodities (i.e. Oil at $60 and Gas at $3 vs. Oil at $40 and Gas at $2, both for a ratio of 20). These calculations assume a price of crude at $60/barrel, which represents the median of current analyst estimates for a 6 month price target, and natural gas at the corresponding value to satisfy the given ratio. Of note, real world returns may actually be boosted compared to these projections. It is well-established that rollover losses from contango can decimate an ETF. This is something that has plagued natural gas ETFs given the frequency at which this commodity trades with a large contango. Oil traditionally trades at a much smaller contango. Thus “excess” profits in the UNG short due to contango not affiliated with organic price movements will likely outweigh much smaller “excess” losses in the USO long due to contango. (click to enlarge) Figure 3: Projected profitability of a Long USO/Short UNG Pair Trade depending on Oil/Gas Ratio Should the ratio bounce just 30% to 20, the trade will return 14%. Should the ratio return to its 5-year historical average of 25, the trade returns 23%. I am currently invested in this trade using a position size that comprises 15% of my portfolio. Should the ratio slump under 15, I will look to slowly add to my positions. These returns can be boosted by using leveraged ETFs. Figure 4 below shows the same curve using a long Velocity Shares 3x Crude Oil ETN (NYSEARCA: UWTI ) and short Velocity Shares 3x Natural Gas ETN (NYSEARCA: UGAZ ) pair trade. (click to enlarge) Figure 4: Projected profitability of a Long UWTI/Short UGAZ Pair Trade depending on Oil/Gas Ratio Using this trade, profits will be around 41% should the ratio recover to 20 and 70% should the ratio climb to 25. However, this trade is not without risk. The excess leverage boosts losses such that should the crude oil-to-natural gas ratio fall to 10, losses will comprise the entire position due to the ballooning value of the short UGAZ short position. Secondly, the leveraged ETFs are not designed to track their underlying commodities in the long term. These ETFs tend to underperform, particularly in a choppy trade environment. Thus, should it take the oil-to-gas ratio > 6 months to reach a target level, expect actual returns to be less than projected. Beyond simple technicals-oil is due for a bounce after a nearly linear 6-month decline-the fundamental rational behind this trade is simple. As natural gas becomes more expensive relative to crude oil, it becomes less and less profitable to drill for liquid hydrocarbons versus gaseous hydrocarbons and rigs are gradually shunted from oil-directed to gas-directed. This trend is already reflected in the Baker Hughes Rig count. Figure 5 below shows the % change in oil-directed and gas-directed rigs over the past 6-months. (click to enlarge) Figure 5: Baker Hughes Rig Count Change In Oil And Gas Rigs Over The Last Six Months (Source: Baker Hughes ) Natural Gas-directed rigs have fallen 4.9% to 310 as of last Friday while Crude Oil rigs have fallen by 11.0% to 1366, or by 170 oil rigs and 16 gas rigs. Should this trend continue, it is likely that the crude oil supply will gradually stabilize while natural gas supply is more likely to remain near record levels, increasing the odds that the oil-to-gas ratio normalizes to historical levels. Additional disclosure: The author is also short UNG as discussed in the article. Scalper1 News
Scalper1 News