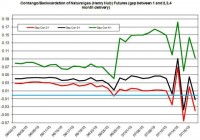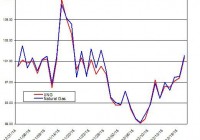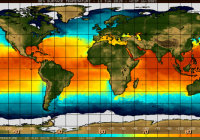
Summary Its optimal pricing is based around the 52-week low. Record heat projections will drive consumption. Improved technology and increasing demand will bolster exports. Basic Information This index is composed entirely of natural gas futures contracts and is derived by reference to the price levels of the futures contracts on a single commodity as well as the discount or premium obtained by rolling hypothetical positions in such contracts forward as they approach delivery. Currently, Velocity Shares 3X Long Natural Gas ETN (NYSEARCA: UGAZ ) is priced at 2.29. UGAZ was created 02/07/12. There are 295.6 Million shared outstanding, no dividends, and a high expense ratio at 1.65. It is a very volatile ETN and should not be traded without serious forethought. I recommend buying UGAZ around a target price of 2.1 throughout the duration of the summer. Also, its competitors include: BOIL , UNG , DGAZ , and DWTI . Investment Summary Case for Buying: Record summer heat projections exacerbated by warm Pacific upwelling from El Nino will increase consumption. The Energy Information Administration projects increasing consumption and demand from 2015-2016 particularly in the short term. Increasing export demand from Mexico and domestic cost cutting will improve profitability. Decreased rig count and decreased crude oil production may lead to higher crude prices. Increasingly efficient and improved drilling techniques and increased exploitation of the Marcellus Shale will lead to domestic production particularly in the Gulf of Mexico may increase natural gas demand due to the historically inverse relationship between natural gas and crude oil. Increasing coal retirement due to more stringent regulation may lead to higher demand for cheaper energy sources such as natural gas. This is a possible value buy around 52 week low. Case for Abstaining: Natural gas historically has shown massive volatility and comes with high risks. UGAZ in particular has a very high expense ratio. Seasonality and increasing natural gas consumption from A/C and other sources may already be accounted for in the price of the ETN. Rise in prices may cut affect profitability margins. Record Summer Heat El Nino is here and world temperatures are expected to be hotter than average this summer. Particularly Southern Upwelling near South America will lead to hotter conditions in South/Central America as well as the majority of the west coast. Temperatures will be hotter than average along parts of the East coast as well. The center of the US, however, will be slightly cooler than average. Overall hotter temperatures will increase natural gas prices as consumption increases particularly from A/C and industrial consumption. Natural Gas Consumption The Energy Information Administration forecasts total natural gas consumption at 76.6 Bcf/d (billion cubic feet per day) in 2016, 76.7 bcf/d in 2015 on average (which accounts for the warmer than average winter). Consumptive growth has largely been driven by industrial and electric power sectors. Seasonal usage generally peaks in mid July. Natural Gas Replacing Coal? Increasing worldwide pressure to limit carbon emissions and implement emission caps may be detrimental to the coal industry. Cleaner burning natural gas may prove to be a viable alternative. The coal industry is transitioning towards clean coal technology, however the R&D and process of implementing the technology will be a long and expensive process. Natural Gas Production and Trade Natural gas production is expected to increase by 4.2 bcf/d (5.7%) and 1.6 bcf/d from 2015 to 2016 alone. Increasing production in lower 48 states is expected to offset declining production in the Gulf of Mexico. Increase drilling efficiency will continue to support growing natural gas production despite relatively low natural gas prices. Most growth is expected to come from the Marcellus Shale. Many backlogged wells are expected to be completed and new pipelines are expected to deliver Marcellus gas to the Northeast. Increased domestic production is expected to reduce demand for Canadian imports and increase export demand to Mexico. Exports from the Eagle Ford Shale are expected to supply growing demand from Mexico’s electric power sector, coupled with flat Mexican natural gas production. LNG gross exports expected to increase to 0.79 bcf/d in 2016 with increasing build of major LNG liquefaction plant in lower 48. Natural Gas Prices The average commodity price was 2.85/MMBtu in May (24 cent increase from April). It is projected at: $2.97 in 2015 and $3.32 in 2016. The government projects steadily increasing prices, demand, and consumption of natural gas in the near future. Also, seasonality investor sentiment, and volatility from 3X leverage may help UGAZ push higher. UGAZ Trend UGAZ data by YCharts UGAZ is near its 52 week low which may indicate it is undervalued; however, it is not traded like a regular equity. Due to the nature of 3X levered ETN’s it is subject to contango (decay) and other variables included in the disclosure. In the short term UGAZ is poised to swing higher, though it would be prudent to wait for it to decrease to a $2.1 price range. Risks/Bearish Case I included a disclaimer for the risks of leveraged ETFs below; however, other points to consider include: 1. Natural gas price increases may only be marginal in the short term 2. UGAZ has a very high expense ratio that is justified by its volatility 3. UGAZ is high risk/high reward in nature and should not be invested in without serious forethought. Anything less is gambling 4. There are safer alternatives. UNG tracks U.S. natural gas one to one and I believe is a safer investment Disclaimer: The risks of investing in a 3X leveraged commodity trading vehicle like UGAZ/UWTI are much greater than those of other vehicles. These risks include (source: Velocitysharesetns.com/ugaz ): 1. ETNs are only suitable for knowledgeable investors seeking daily exposure (including inverse or leveraged exposure) to the underlying index. ETNs are intended for short-term trading, therefore investors with a horizon longer than one day trading should carefully consider whether the ETNs are appropriate for their investment portfolio. 2. Because the inverse leveraged ETNs and leveraged long ETNs are linked to the daily performance of the applicable underlying Index and include either inverse and/or leveraged exposure, changes in the market price of the underlying futures will have a greater likelihood of causing such ETNs to be worth zero than if such ETNs were not linked to the inverse or leveraged return of the applicable underlying Index. 3. The ETNs do not guarantee any return of principal at maturity and do not pay any interest during their term. 4. At higher levels of volatility, and since the ETNs are not principal protected, there is a significant chance of a complete loss of ETN value even if the performance of the index is flat. 5. The closing indicative value on each valuation date is determined in part by reference to the daily percentage change in the level of the underlying index. As a result, to the extent the closing indicative value of the ETNs is greater than or less than the initial indicative value, subsequent changes in the level of the index may have a bigger or smaller impact on the closing indicative value of the ETNs than if the closing indicative value remained constant at the initial indicative value. For example, assuming an initial indicative value of $100, if the closing indicative value of the ETNs increases above $100, a subsequent 1% daily change in the level of the index will result in more than a $1 decrease in the closing indicative value of the ETNs. Likewise, if the closing indicative value of the ETNs is less than $100, a 1% increase in the level of the index will result in less than a $1 increase in the closing indicative value of the ETNs. 6. If the level of the underlying index decreases or does not increase sufficiently (or if it increases or does not decrease sufficiently in the case of the inverse ETNs), to offset the effect of the Daily Investor Fee over the term of the ETNs, the investor will receive less than the principal amount of his investment upon early redemption, acceleration or maturity of the Notes. 7. This particular ETN also runs the risk of being decayed by contango which is defined by Investopedia as: 8. A situation where the future price of a commodity is above the expected future spot price. Contango refers to a situation where the future spot price is below the current price, and people are willing to pay more for a commodity at some point in the future than the actual expected price of the commodity. This may be due to people’s desire to pay a premium to have the commodity in the future rather than paying the costs of storage and carry costs of buying the commodity today. 9. Finally, there are general risks that should also be considered such as liquidity risk (Source: Investopedia.com): 10. The risk stemming from the lack of marketability of an investment that cannot be bought or sold quickly enough to prevent or minimize a loss. Liquidity risk is typically reflected in unusually wide bid-ask spreads or large price movements (especially to the downside – which are magnified in leveraged ETNs). The rule of thumb is that the smaller the size of the security or its issuer, the larger the liquidity risk. Comparisons – Three-Year Graphs In relation to TNX (10X 10-year yield) : In regards to my goal of finding an adequate hedge to 10 year interest rates, I chose to compare TNX to UGAZ. In many regards, UGAZ has shown to move inversely to TNX, albeit in a dramatic and imperfectly correlated fashion. I believe higher interest rates stifle exploration, extraction, and innovation in the energy sector which lead to higher costs and explain the inverse relationship between the two indexes. However, there are so many other factors that affect each index that it is extremely difficult to make such broad speculations. For example, Natural gas is subject to all the risks that come with commodities. Demand, seasonality, consumption, pricing, weather, regulation, etc. Interest rates are subject to different forces altogether. For example, monetary policy, the federal reserve, inflation, etc. UGAZ is a good hedge in the sense that one can hedge risk vs. riskless investments. As investments go, UGAZ is about as risky as they come, while investing in an etf tied to treasury yields has far less risk or indexes reflecting the treasury yield is about as riskless as an investment as one can make. UGAZ is good for managing risk. Playing UGAZ in the long term (more than a year) would be unwise because of its volatile nature. Relation to UNG (red line) UNG is the regular natural gas ETF while UGAZ is a tripled levered ETN. An investor looking to play natural gas long would be far better off investing in UNG in order to manage market risk and decrease market fees. UNG is a less risky investment and a better play in the long term. For short term trading, though UGAZ is a far more exciting play. Relation to UWTI (red line) UWTI is the 3X levered Crude oil index. Like UGAZ, its price is derived from crude oil futures, and it is not to be traded lightly. UGAZ has been more volatile in recent years. Interestingly, UGAZ and UWTI have historically been inversely correlated to one another. However, in the last the year the flooded energy market has caused both crude and natural gas to take a correlated nose dive in price. Crude is expected to stabilize around $60 for the next couple years until increasing in price as consumption and demand rise to meet supply. Conclusion I believe there is a very good chance natural gas prices and consumption will continue to increase over the summer. A hot summer, increasing demand, battered prices, decreasing usage of coal, and improvements in technology all contribute to this view. UNG would be an optimal investment in natural gas; however, UGAZ would be a better short term tool for managing risk and could potentially pay out huge rewards (though with high risks and potential for decay). Disclosure: The author has no positions in any stocks mentioned, and no plans to initiate any positions within the next 72 hours. (More…) The author wrote this article themselves, and it expresses their own opinions. The author is not receiving compensation for it (other than from Seeking Alpha). The author has no business relationship with any company whose stock is mentioned in this article.