Tag Archives: undefined

10 Reasons Why UTG Is Worth A Look

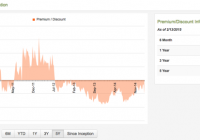
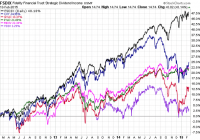
In a world of low-cost indexed ETFs, actively managed closed-end funds are largely unknown to most retail investors. Reaves Utility Income Fund offers an attractive proposition for those seeing to buy-and-hold over the long term. In this article, I present my top ten reasons to consider UTG for your income or DGI portfolio. Reaves Utility Income Fund (NYSEMKT: UTG ) is an actively managed closed-end fund that invests in utilities. The fund currently sports a hefty baseline expense ratio of 1.16%. Study after statistically-based study has shown that active funds with high expense ratios should be avoided ( Vanguard on indexing , Vanguard on expenses , ZeroHedge ). So why in the world would I be recommending that enterprising investors seeking income consider a long-term investment in UTG? I’ll give you ten reasons! Reason One: UTG’s yield is nearly triple the 10-Year Treasury’s. As of 2/17/2015, UTG yields 5.87% while the 10-year treasury yields 2.02%. The rate is also 250 basis points above the Utilities Select Sector SPDR ETF (NYSEARCA: XLU ) yield of 3.34%. The global demand for secure income has bid up the price of nearly every defensive asset class, whether it be bonds, income equities, or alternative assets. Not too many set-it-and-forget-it holdings can offer UTG’s level of income. Reason Two: UTG is abnormally cheap. Closed-end funds trade based on supply and demand. As such, the Market Price of a closed-end fund is always either at a premium or at a discount to Net Asset Value. The fund’s premium/discount as of 2/17/2015 closing is -5.24%. The first benefit of such a discount is an enhanced yield. At par, UTG yields 29 basis points less. The second and more exciting benefit is an improved risk-reward prospect. UTG’s discount is currently more attractive than its 6-month, 1-year, 3-year, and 5-year average discounts. On 2/4/2015, UTG closed at a premium/discount of -1.15%, indicating recent selling beyond Net Asset Value may have been overdone. One might expect premium/discount to trend back towards its historical averages, making you money in the process. (click to enlarge) (Source: CEF Connect UTG Pricing Information ) Reason Three: UTG has a track record of outperformance. Assuming reinvested dividends, on both a Net Asset Value or a Market Price basis… On a one-year, three-year, or five-year time frame… Compared to the S&P Utilities Index or the Dow Jones Utility Average… UTG wins. (Source: UTG’s 2014 Annual Report , dated 10/31/2014) Reason Four: UTG pays dividends every month. That means UTG compounds more quickly than a quarterly or annual dividend payer. When you account for monthly compounding, UTG’s current 5.87% yield is actually above 6% annualized . Over a generation, this sliver of added value can mean serious money. Reason Five: UTG utilizes healthy heaping of leverage. A closed-end fund’s asset base is fixed. Price is based on supply and demand rather than on fund inflows and outflows. Investors can’t panic sell and force the fund to sell holdings. Banks use this secure asset base as collateral to issue debt to UTG, creating leverage. UTG employs a fixed amount of leverage that is irrespective of its Net Asset Value growth. As the fund’s NAV has increased yearly, the percent leverage has decreased. According to CEF Connect , 23.4% of UTG’s NAV is leverage. When I say healthy , there are basically two negatives of leverage. First, leverage increases volatility compared to a similar unlevered investment. Secondly, leverage costs money, since the underwriting bank needs to make a profit. In my humble opinion, I avoid leverage over 33% or an interest expense over 1%. Reason Six: UTG’s distribution is safe. UTG’s dividends are primarily sourced from ordinary income. In 2014, ordinary income made up 90% of UTG’s dividend payments. To account for the remainder, UTG taps into capital gains. (UTG, like many closed-end funds, has a special exception to Section 19(b)(1) of the Securities Exchange Act of 1934 allowing distributions to be paid from capital gains.) Please kindly note the size of the Unrealized Appreciation account in the figure below: $366 million. Compare that with the $47 million that UTG paid in 2014 dividends. UTG could fund distributions for years with just unrealized gains, although I’d probably be long gone if they tried pulling that stunt. Compare this to other closed-end funds with 30% or more sourced from the dreaded Return of Capital and with continually-eroding Net Asset Values. (Source: UTG’s 2014 Annual Report , dated 10/31/2014) Reason Seven: UTG’s distribution is likely to grow. The fund has a strong track record of dividend increases. In the fund’s eleven-year history, UTG has increased its regular monthly dividend eight times. The most recent increase of 10% occurred in December 2014, which followed a 4.8% increase the year prior. Many of UTG’s holdings are habitually growing their dividends, which bodes well for the fund’s long-term prospects. Reason Eight: UTG diversifies the definition of utilities. UTG buys utility-like assets with high barriers to entry across a multitude of industries: renewable energy, oil pipelines, energy infrastructure, railroads, water, and real estate. But what really got me was their willingness to include the likes of Vodafone (NASDAQ: VOD ), Time Warner Cable (NYSE: TWC ), American Tower (NYSE: AMT ), and Annaly Capital (NYSE: NLY ). (Source: UTG’s 2014 Annual Report , dated 10/31/2014) Reason Nine: UTG’s management believes in long-term investing. The annual portfolio turnover ratio over the last five years has been 26%, 30%, 27%, 34%, and 53%. This level of commitment of the fund to its holdings is a strong signal of confidence, and allows the company to focus on of five- and ten-year trends rather than on quarterly noise. (Source: UTG’s 2014 Annual Report , dated 10/31/2014) Reason Ten: UTG is naturally hedged to currency risk. According to its 2014 report, 88% of its assets are invested in the U.S. By keeping a large majority of its assets and liabilities denominated in U.S. dollars, UTG can avoid variable earnings and costly hedging strategies. UTG won’t miss a dividend payment due to a swing in the Swiss franc or Russian ruble. Bonus Reason Eleven: UTG has been vetted by smart money. Bill Gross recommended UTG in the 2010 , 2012 , and 2014 Barron’s Roundtables. Guggenheim Investments holds UTG as a core position in its Infrastructure & MLP CEF Mutual Fund . Finally, Morgan Stanley, Bank of America, and Wells Fargo collectively own 871,000 shares of UTG, or roughly 3% of the float. Conclusion: Enterprising retail investors seeking consistent income should strongly consider Reaves Utility Income Fund. UTG has posted impressive total return numbers over the long haul. And for what it lacks by being a boring utility fund, UTG makes up for it with a fat monthly dividend that will make you smile. Disclosure: The author is long UTG. (More…) The author wrote this article themselves, and it expresses their own opinions. The author is not receiving compensation for it. The author has no business relationship with any company whose stock is mentioned in this article. Additional disclosure: All figures in this article may contain calculation, typo, and other errors. Also, everybody has a unique investment style: different people panic sell at different losses and experience the pleasure of gains differently. Please take responsibility for your investments and perform your own necessary due diligence. Or just buy the S&P and sleep easy.

American Century Makes Its Liquid Alts Move

By DailyAlts Staff American Century has been fairly quiet on the liquid alternatives front as the product category has experienced a boom since the 2008 financial crisis. In 2011, the firm launched two “130/30” funds and a market-neutral fund, and it has been operating another equity market-neutral fund since 2005, but American Century has largely been on the sideline of the liquid alts movement. That is, until now. On February 3, American Century filed paperwork with the Securities and Exchange Commission (SEC) seeking approval for three new alternative mutual funds. The firm has also initiated a new brand for its alternatives business and filed to trademark the brand “AC Alternatives,” which is used on the new line of alternative mutual funds. The AC Alternatives Income Fund The AC Alternatives Income Fund’s stated objective is providing investors with “diverse sources of income.” In pursuit of this objective, the fund’s managers will combine several distinct strategies designed to capture current yield, while also seeking to protect inflation-adjusted purchasing power through capital appreciation. Some of the fund’s strategies and investments will include: Corporate credit strategies Structured credit strategies Real estate strategies MLP strategies Income-oriented equity strategies The fund will also pursue PWP overlay strategies, which involve “exploiting market opportunities, managing inflows and outflows of fund assets and/or hedging against certain risks” identified by sub-advisor PWP. Arrowpoint Partners and Good Hill Partners are also listed as sub-advisors to the fund, but according to the prospectus, PWP “may make recommendations to the advisor to terminate and replace underlying sub-advisors from time to time.” The AC Alternatives Equity Fund The AC Alternatives Equity Fund will employ several equity strategies, with low correlation to one another and the broad market, in pursuit of capital appreciation. As with the AC Alternatives Income Fund, PWP is a sub-advisor and PWP overlay strategies are among the equity strategies that will be utilized by the AC Alternatives Equity Fund. Other strategies include: Long-only Long/short Event driven Trading oriented strategies In addition to the overlay strategies, PWP will also sub-advise the fund’s event driven and trading strategies, while Passport Capital will sub-advise its long/short equity strategies. The AC Alternatives Multi-Strategy Fund Finally, the AC Alternatives Multi-Strategy Fund will pursue four distinct strategies managed by four different sub-advisors, as well as four additional strategies sub-advised by PWP. The strategies, which span asset classes, are listed below with their sub-advisors in parenthesis: Long/short credit (Good Hill Partners) Long/short credit (MAST Capital) Event driven (Levin Capital) Long/short equity (Passport Capital) Overlay (PWP) Global macro (PWP) Real assets (PWP) Trading strategies (PWP) American Century’s Existing Alts The three new alternative mutual funds will join American Century’s current lineup of liquid alts, which include a pair of “130/30” funds (arguably not an alternative strategy since it has a beta of 1.0 to its benchmark) and a pair of market-neutral equity funds. The “130/30” funds, which average 130% long and 30% short equity exposure, have outperformed their long-only counterparts. The American Century Core Equity Plus Fund (MUTF: ACPVX ), with approximately $170 million in fund assets, has a five-star rating from Morningstar and generated a 14.99% return for the year ending January 30. The American Century Disciplined Growth Plus Fund (MUTF: ACDJX ), with approximately $33 million in fund assets, also has a five-star rating, and it generated an even better 20.21% return for the year ending January 30. The American Century Market Neutral Value Fund (MUTF: ACVVX ) launched at the same time as the two “130/30” funds and currently has approximately $76 million of fund assets. It has a four-star rating from Morningstar and generated a 3.31% return for the year ending January 30, which was still enough to rank it in the top 19% of its category. American Century’s oldest liquid alts product, the American Century Equity Market Neutral Fund (MUTF: ALHIX ), also has a four-star rating. It returned 2.07% for the year ending January 30 and currently has approximately $117 million of fund assets. For more information, visit americancentury.com .

Fidelity Strategic Dividend & Income Fund Gets Results

Summary FSDIX is a multi-asset fund that has held up very well versus newer multi-asset ETFs. FSDIX aims for capital appreciation in addition to income, so yield is relatively low at 2.34 percent. FSDIX is less volatile than the competition. The Fidelity Strategic Dividend & Income Fund (MUTF: FSDIX ) was established in December 2003. The fund offers investors a multi-asset approach to income, with five major asset classes included in the portfolio. A 2.34 percent yield puts the fund’s yield not far above that of the broader market, but it comes with wider diversification and lower volatility. Manager Outlook With over two decades of experience in the financial investment industry, Joanna Bewick has served as the portfolio’s lead manager since 2008. She is assisted by co-manager Ford O’Neil who has been with Fidelity since 1990. Both of them also manage the Fidelity Strategic Income Fund (MUTF: FSICX ). The fund’s default allocations are 50 percent common stock, 15 percent convertible securities, 15 percent in REITs or other real estate-related investments, and 20 percent preferred stocks. The lead managers believe the U.S. economy will continue to improve across the majority of economic sectors. They also see the economy as being in a mid-cycle expansion, which creates an expectation of moderate corporate earnings growth. The managers believe asset classes have a fair to slightly rich valuation. Although the quantitative easing program has ended, their expectation is that any interest rate adjustments by the Federal Reserve will be gradual and data dependent. Recent low inflation numbers provide the Fed with more leeway for keeping rates low in the near term. This creates a situation where domestic bond yields are more attractive than the returns of other sovereign bonds. While they predict that dividends and income are likely to play more of a role in total returns than capital appreciation, the increased volatility may create more investment opportunities. The result is a continued bias towards dividend paying stocks, which still comprise the largest portion of the fund, due to their current income and secondary potential for capital appreciation. The fund will also maintain a normal weighting of REITs on a risk-adjusted basis as long as the macroeconomic environment remains steady. While the fundamentals of this asset class remain strong and could produce significant returns, the weighting minimizes the impact of rising interest rates that could hamper returns. Managers believe that it may be difficult to find opportunities to deploy cash in the shrinking convertible securities market, which may cause an underweighting of this asset class. They also expect to remain underweight preferred stock until valuations become more advantageous. Managers will rebalance the fund based on market conditions. Asset Allocation and Security Selection The fund seeks to provide investors with reasonable current income with the potential for capital appreciation. With an investment strategy focused on equity securities that provide current income and have the potential for capital appreciation, the no-load fund tends to concentrate on value stocks. The portfolio invests in domestic and foreign issues. When building the portfolio, lead and sub-portfolio managers evaluate securities based on the macroeconomic environment, investor sentiment and fundamentals, as well as their current and historic valuations. The team manages risks and shift allocations based on a bull-or-bear case for each asset class. Over the past quarter ending December 2014, the fund continued to favor dividend paying equities. Veteran investor Scott Offen, who has been with Fidelity since 1985, manages the common stock sleeve. His focus is on mega-cap dividend paying stocks of companies with wide economic moats, with a portfolio yield 50 percent greater than the S&P 500 and lower volatility. In addition to boasting a 3 percent yield, a strong selection of individual securities in consumer discretionary, energy and industrials helped this sub-portfolio outpace the benchmark and boost the fund’s overall returns. Adam Kramer manages the fund’s preferred stock and convertibles sleeves. Through his acumen, the fund has held up better during recent stock market declines. While the yields on preferred shares were attractive, their long durations were considered a negative factor. The resulting underweighting proved advantageous as this sector underperformed the overall market. The main drag on results was the concentration in banks, healthcare and cable TV. Another modest advantage was Kramer’s underweighting of convertible securities as this asset class also underperformed. This decision was based upon the manager’s belief that good investment opportunities were more difficult to obtain as the overall number of available issues decline. Information technology and industrial securities generated the most drag on this sub-portfolio. Minimizing exposure to these two underperforming asset classes provided a modest advantage for the overall fund. Managed by Samuel Ward, the real estate-related sleeve held a neutral weighting of REITs. This position was a contributor to the fund’s overall performance as the sector had a tremendous run. The greatest contributors were the fund’s investments in apartment and office REITs, which outperformed relative to the benchmark index. While the managers believe that fundamentals remain strong, they remain vigilant on interest rates and the possible negative impact that rising interest rates could have on the sector. Portfolio Composition and Holdings As of December 2014, this four-star Morningstar rated fund has $4.82 billion in assets under management. Compared to its goal of a neutral mix, the fund is slightly overweight common stocks and preferred stocks, while being underweight convertibles. Individual holdings are concentrated in financials, information technology, healthcare and consumer staples. The fund is underweight telecommunications and materials. While 95.84 percent of holdings are domestic securities, the portfolio has a small exposure to Europe and Asia, as well as a slight exposure to emerging markets. The market capitalization of the portfolio is 52.48 percent giant, 23.75 percent large and 16.15 percent mid cap, as well as 6.52 percent small and 1.09 percent micro cap. The fund has a P/E ratio of 18.73 and a price-to-book ratio of 2.59. The fund’s top five holdings are securities issued by Exxon Mobil (NYSE: XOM ), Chevron (NYSE: CVX ), Proctor & Gamble (NYSE: PG ), Johnson & Johnson (NYSE: JNJ ) and IBM (NYSE: IBM ). These holdings comprise 11.85 percent of the total portfolio. Roughly 9 percent of assets are in fixed income, the specialty of lead and co-managers Bewick and O’Neil. The fixed income portion of the portfolio is concentrated in debt instruments rated BBB, BB and B, with a focus on maturities between three and seven years. The fund’s average duration is 3.91 years with a 30-day yield of 2.34 percent. Historical Performance and Risk Earning a high average return rating from Morningstar, FSDIX has delivered annualized returns of 14.48 percent, 13.85 percent and 13.87 percent over the past 1, 3 and 5 years, respectively. This compares to the category averages of 8.63 percent, 11.58 percent and 11.32 percent over the same periods. FSDIX has a low risk rating from Morningstar. The fund’s three-year beta and standard deviation of 0.98 and 6.64 compare favorably to the category ratings of 1.29 and 8.45. The SPDR Dividend ETF (NYSEARCA: SDY ) has a standard deviation of 9.26, making FSDIX less volatile than plain vanilla dividend funds. Fees, Expenses and Distributions The fund does not have any 12b-1, front-end or redemption fees. The low 0.74 percent expense ratio is below the category average of 0.92 percent. FSDIX supports automatic account builder and direct deposit functions. It has a minimum initial investment of $2,500 for both taxable and non-taxable accounts. Conclusion FSDIX is a multi-asset fund that offers a yield similar to a dividend ETF, but with lower volatility. Income growth hasn’t been great given the fact that certain asset classes, such as preferred shares, do not pay rising dividends. Shares fell 41 percent in 2008, so while they are less volatile, they aren’t without risk. However, some of those losses were excessive due to fears about bank solvency during the crisis, which hit preferred shares hard. In a more typical and milder bear market, the fund should hold up better than the broader market. FSDIX fund fills a niche for investors who want slightly higher income along with their capital appreciation, plus lower volatility. Investors who want to go the ETF route can check out some of the best multi-asset ETFs . FSDIX compares favorably to these funds thanks to a heavyweight towards equities and the fact that the equity heavy Guggenheim Multi-Asset Income ETF (NYSEARCA: CVY ) was stung by exposure to energy-related holdings. (click to enlarge) Disclosure: The author has no positions in any stocks mentioned, and no plans to initiate any positions within the next 72 hours. (More…) The author wrote this article themselves, and it expresses their own opinions. The author is not receiving compensation for it (other than from Seeking Alpha). The author has no business relationship with any company whose stock is mentioned in this article.