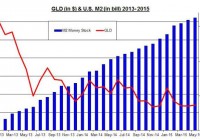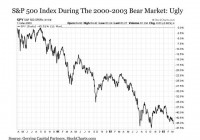
Summary Many investors understandably reflect on the past two bear markets in stocks with dread. But just because the S&P 500 Index is down does not mean that major segments within the stock market cannot go up at the same time. It also does not mean that other asset classes are not enjoying roaring bull markets. A truly diversified portfolio strategy should be continuously exploring this opportunity set from both a timing and allocation standpoint. Many investors understandably reflect on the past two bear markets in stocks with dread. Not only did many have a bad experience the first two times around, but they look at today’s bull market and may have some concern that a third go around may be lurking around the corner. But investors should not fear. For just because the major stock market indices such as the S&P 500 Index took a beating the last time around, it does not mean that every stock on the planet went down. And it also does not mean that a lot of investors in other frequently overlooked asset classes were not able to generate handsome returns while investors were fleeing out of stocks. More often than not, one can always find bulls hiding behind bears in investment markets. You just have to look for them. Remembering The 2000 to 2003 Bear Market In Stocks Our first look is at the S&P 500 Index (NYSEARCA: SPY ) in the aftermath of the tech bubble bursting. From its peak in March 2000 until its final bottom in March 2003; in a word, it was ugly, as S&P 500 Index lost nearly half of its value even after dividends over this time period. (click to enlarge) But even sticking with the broader market, here is the first important point to recall. Stocks typically do not go down in a straight line. For during the 2000 to 2003 bear market, the S&P 500 Index did provide investors with several tradable rallies in with positive returns in excess of double digits along the way. The key was identifying the trend to catch these rallies. But capturing this upside, of course, is far easier said than done, and many investors would understandably rather not be bothered with attempting to trade the market in this manner. (click to enlarge) Fortunately for investors, the stock market at the time provided abundant upside opportunities. After all, a great deal of the damage from the tech bubble was sustained in the technology sector (NYSEARCA: XLK ), which lost a remarkable -82% at the depths of the 2000 to 2003 bear market. (click to enlarge) So as long as you were out of the way of the once high-flying technology sector at the time, you likely fared much better than the broader market. Viewing the stock market on a sector basis demonstrates why. Of the eight other GICS sectors that are represented by the Select Sector SPDR Indices, only four even entered into bear market territory at down -20% from the S&P 500 Index peak in March 2000. Among the cyclical sectors, Industrials (NYSEARCA: XLI ) were down -37%, Consumer Discretionary (NYSEARCA: XLY ) was down -26%, Materials (NYSEARCA: XLB ) were down -23% and Energy (NYSEARCA: XLE ) fell -19%. What is more notable is the timing of these declines, as three of these four sectors were still in positive territory from the peak of the S&P 500 Index in March 2000 up until June 2002. In other words, if you were still fully in stocks more than two years after the start of the bear market, you were likely well attuned to the risks around you at that point. (click to enlarge) As would be expected, the performance among defensive stocks was even better. Consumer Staples (NYSEARCA: XLP ) only fell -13%, Health Care (NYSEARCA: XLV ) was down just -18%, Utilities (NYSEARCA: XLU ) dropped by -31% and interest rate sensitive financials were lower by -19%. In short, three of four sectors avoided bear market territory altogether. Moreover, Consumer Staples were up as much as +30% and Financials and Utilities as much as +10% as late as early 2002. What the heck happened to utilities at the time? This was a time when the typically staid utilities were deregulating and engaging in such ventures as electricity trading and telecom activities. Many have returned to their more traditional activities in the years since. (click to enlarge) Of course, the stock market is not the only place to allocate capital, and many investors in different asset classes enjoyed tremendous upside returns while stocks were moving lower. Some were in fact in impressive bull markets. For example, long-term U.S. Treasury bonds (represented here by the Vanguard Long Term Treasury Fund (MUTF: VUSTX )) were soaring by as much as +45% during the bear market in stocks. And gold (NYSEARCA: GLD ) gained over +20% after a slow start, as the shift toward a weak dollar in early 2001 helped spark the dawn of a new secular bull market in the yellow metal. (click to enlarge) The key takeaway from the 2000 to 2003 bear market — as long as you were out of the way of the frothiest areas of the market at the time, which were technology, media and telecom stocks — you likely fared much better. Much of the declines in value that you sustained would have been concentrated over a fairly short time of less than a year from the summer of 2002 through the spring of 2003. And if you were diversified beyond stocks in other uncorrelated to negatively correlated categories like Treasuries (NYSEARCA: TLT ) and gold, you may have even been able to break even if not generate a positive return over the duration of this stock bear market from 2000 to 2003. Remembering The 2007 to 2009 Bear Market In Stocks Now the bear market in stocks that accompanied the financial crisis from 2007 to 2009 was far more unforgiving. But that still does not mean that gains were not there to be had for those that were positioned correctly. From a stock market perspective, it was a fairly unforgiving time. Overall, the S&P 500 Index declined by -54%, and unlike the preceding bear market it managed to take just about every sector down with it. (click to enlarge) The standout to the downside, of course, was the financial sector, which lost -82% of its value. (click to enlarge) Cyclicals in general followed the path of the S&P 500 Index to the downside. The lone exception was the Energy and Materials sectors, which made a decent go of it through the summer of 2008 before finally capitulating to the downside. (click to enlarge) Defensive sectors did hold up better, but not enough where one would feel good about their overall experience. Consumer Staples stocks fared the best having fallen by -27%, while Health Care and Utilities were down in the neighborhood of -40%. What was notable, however, was that both Consumer Staples and Utilities were still in positive territory in the second half of 2008 before finally giving up to the downside once the effects of the Lehman failure and its aftermath started to spread like wildfire. (click to enlarge) Up to this point, we already have a key takeaway for stock investors. Yes, the entire stock market was soundly beaten during the financial crisis bear market by the time March 2009 rolled around, but it is not as though every sector was completely obliterated all at once. We were more than a year into the bear market at the time by the summer of 2008, and four out of nine stock market sectors were still in positive territory. The lesson? Even the worst of bear markets gives you time to act and get out if needed, as long as you are not invested at the epicenter of the problem, which was the financial sector this time around. But for the investor that wishes to avoid such losses that might come with any future bear market in stocks, what are they to do? The answer — recognize that to be invested does not mean that you must be exclusively invested in the stock market. Nor do you have to be exclusively invested anywhere else for that matter, including bonds, commodities, cash or anything else for that matter. For just as the stock market was struggling through a difficult bear market from 2007 to 2009, a number of other asset classes were enjoying rousing bull markets. Case in point. Let’s revisit long-term U.S. Treasuries. While it was a bear market in stocks at the time, it was a roaring bull market in U.S. Treasuries. Overall, the category advanced by more than +50% at a time when the stock market was down by more than -50%. Not too shabby. How about gold? The metal that so many like to deride gained +36% over the course of the financial crisis bear market. (click to enlarge) And for those that are more aggressively inclined, those that were short the stock market through a broadly defined unleveraged instrument such as the ProShares Short S&P 500 (NYSEARCA: SH ) at that time nearly doubled their investment. Another possibility is to allocate on the margins to the VIX and other volatility instruments (NYSEARCA: VXX ). (click to enlarge) It is critically important to note, however, that such inverse approaches are not for the faint of heart. Moreover, they must be handled with care from a timing standpoint. For anyone that has tried to short the market or incorporate an exposure to volatility in their portfolio since March 2009, the experience has been absolutely excruciating. It is also important to note that just because an asset class performed well during a past bear market in stocks does not mean it will necessarily do so the next time around. This, of course, is part of the ongoing portfolio analysis and monitoring to determine exactly what asset classes might perform best the next time around. Bottom Line When contemplating the next bear market in stocks, whether it comes tomorrow or three years from now (it has to happen sometime), investors should not be thinking about selling out of the stock market and running for the hills. Instead, they need to stay in the trenches and have a plan. Think about where the unstable hot zones might be in the current stock market and look to tread lightly in those areas. Consider where the more stable stock market segments reside today and search for opportunities to add incrementally to allocations. Remember that when the bear market finally starts, it is not going to take down every stock all at once. Some might even rise throughout much of the entire experience. And perhaps most importantly, remember that stocks are not the only place where your money has to be allocated if you are participating in capital markets today. More than ever, today’s markets offer investors a broad and diverse arsenal from which to draw to optimize their portfolio from an asset allocation standpoint and look to gain even when the broader stock market may be falling. Disclosure : This article is for information purposes only. There are risks involved with investing including loss of principal. Gerring Capital Partners makes no explicit or implicit guarantee with respect to performance or the outcome of any investment or projections made. There is no guarantee that the goals of the strategies discussed by Gerring Capital Partners will be met. Disclosure: The author has no positions in any stocks mentioned, and no plans to initiate any positions within the next 72 hours. (More…) The author wrote this article themselves, and it expresses their own opinions. The author is not receiving compensation for it (other than from Seeking Alpha). The author has no business relationship with any company whose stock is mentioned in this article. Additional disclosure: I am long stocks via the SPLV as well as selected individual names. I am long Treasuries via the IEF. I also hold a meaningful allocation to cash at the present time.