Tag Archives: undefined

Lipper Closed-End Fund Summary: June 2015

For the second consecutive month both equity and fixed income CEFs suffered negative NAV-based returns (-2.84% and -0.74% on average, respectively, for June) and market-based returns (-4.31% and -2.83%). Year to date, however, both groups just remained in positive territory, returning 0.41% and 0.91% NAV-based returns. While the Russell 2000 and the NASDAQ Composite managed to break into record territory in mid-June, advances to new highs were generally just at the margin. However, at June month-end concerns about the Greek debt drama, looming U.S. interest rate increases, Puerto Rico’s inability to service its public debt, and China’s recent market gyrations weighed heavily on investors. A positive finish for equities on the last trading day of June wasn’t enough to offset the Greek debt-inspired meltdown from the prior day, and many of the major indices witnessed their first quarterly loss in ten. Volatility was on the rise in June. At the beginning of the month rate-hike worries plagued many investors after an upbeat jobs report raised the possibility of an interest rate hike this fall. The Labor Department reported that the U.S. economy had added a better-than-expected 280,000 jobs for May, beating analysts’ expectations of 210,000. Despite a rise in the unemployment rate to 5.5% (as once-discouraged job seekers reentered the labor market), many pundits felt the Federal Reserve would be more likely to raise interest rates sooner rather than later. However, European equities showed signs of weakness, and investor handwringing began in earnest as investors contemplated the looming deadline for Greece to make its first debt payment to the IMF at the end of June. And while early in the month the Shanghai Composite rose above the 5,000 mark to its highest level since January 2008, on Friday, June 19, the Shanghai Composite posted its worst week in more than seven years as investors bailed on some recently strong-performing Chinese start-ups. Worries of high valuations and record levels of margin debt sparked the exodus. Investors’ trepidations were not easily dispelled, and by mid-month more talk about a Greek exit (“Grexit”) from the Eurozone and anxiety before the Federal Open Market Committee’s June meeting led to further selloffs in the equity markets. A combination of an impasse in the Greek debt talks along with a purported quadruple-witching day sent the Dow to a triple-digit decline on Monday, June 29, with Treasuries rallying on the news as investors looked toward safe-haven plays. For June the Dow, the S&P 500, and the NASDAQ were in the red, losing 2.17%, 2.10, and 1.64%, respectively, while a strong small-caps rally helped send the Russell 2000 up 0.59%. Nonetheless, interest concerns trumped the Greek drama, and for the month Treasury yields rose at all maturities, except the three-month. The ten-year yield rose 23 bps to 2.35% by month-end. For the third consecutive month none of the municipal bond CEFs classifications (-0.36%) witnessed plus-side returns for June. However, the municipal bond CEFs macro-classification did mitigate losses better than its domestic taxable bond CEFs (-1.12%) and world bond CEFs (-1.45%) brethren. Despite the Greek debt drama, world equity CEFs (-2.04%) mitigated losses better than their mixed-asset CEFs (-2.11%) and domestic equity CEFs (-3.41%) brethren. And Growth CEFs (+0.68%) posted the only positive return in the equity universe for the month, while Energy MLP CEFs (-8.85%) was at the bottom. For June the median discount of all CEFs widened 135 bps to 10.52%-worse than the 12-month moving average discount (8.92%). Equity CEFs’ median discount widened 90 bps to 10.74%, while fixed income CEFs’ median discount widened 162 bps to 10.44% (their largest month-end discount since October 2008). For the month only 5% of all CEFs traded at a premium to their NAV, with 7% of equity funds and 4% of fixed income funds trading in premium territory.

With High-Yield ETFs, Costs Can Be Hidden

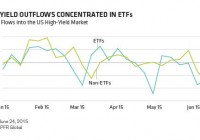
By Gershon Distenfeld More and more investors see exchange-traded funds (ETFs) as an easy and inexpensive way to tap into the high-yield market. We have some friendly advice for them: look again. Financial advisors who use ETFs as core holdings in their clients’ portfolios-and even some institutional investors-often tell us they like them for two big reasons. First, ETFs passively track an index, which means they’re cheaper than actively managed funds. Second, they’re liquid. Unlike mutual funds, which are priced just once a day, ETFs can be bought and sold at any time, just like stocks. But when it comes to high yield, ETFs aren’t really that cheap or that liquid. Look for the Hidden Costs Let’s start with costs. Sure, some ETF management fees are quite a bit lower than mutual fund fees-but that mostly goes for ETFs that invest in highly liquid assets such as equities. In a less liquid market, like high yield, expense ratios can be as high as 40 or 50 basis points-not that much lower than many actively managed mutual funds. It’s also easy to overlook some of the hidden costs. For instance, anyone who wants to buy or sell an ETF must pay a bid-ask spread, the difference between the highest price that buyers are willing to offer and the lowest that sellers are willing to accept. That spread might be narrow for small amounts but wider for larger blocks of shares. And when market volatility rises, bid-ask spreads usually widen across the board. And ETF managers can rack up trading costs even when market volatility is low. This is partly because bonds go into and out of the high-yield benchmarks often-certainly more often than stocks enter and exit the S&P 500 Index. To keep up, ETF managers have to trade the bonds that make up the index more often. Frequent trading can also cause ETF shares to trade at a premium or discount to the calculated net asset value. In theory, this situation shouldn’t last long. If an ETF’s market price exceeds the value of its underlying assets, investors should be able to sell shares in the fund and buy the cheaper underlying bonds. But the US high-yield market has more than 1,000 issuers and even more securities, and it can be difficult for investors to get their hands on specific bonds at short notice. That means investors often end up overpaying. This can work the other way around, too. If something happens to make investors want to cut their high-yield exposure, the easiest way to do that is to sell an ETF. That can push ETF prices down more quickly than the prices of the bonds they invest in, adding to ETF investors’ losses. We saw this in May and June, when worries about higher interest rates rattled fixed-income investors. Outflows from high-yield ETFs outpaced those from the broader high-yield market ( Display ). Are Passive ETFs Really Passive? Investors might also want to consider whether high-yield ETFs are truly passive. For example, the manager of an S&P 500 equity ETF can easily buy all the stocks that make up the index. But as we’ve seen, that isn’t so easy in high yield-the market isn’t as liquid. ETF managers compensate for this by using sampling techniques to help them decide which securities to buy. Can a fund that requires active decision making and frequent trading be considered passive? We think that’s a fair question. Not as Deep as You Think Here’s another question worth asking: just how liquid are ETFs? Those who look closely may find that the pool isn’t quite as deep as they thought. Why? The growing popularity of ETFs means they have to hold an ever larger share of less liquid assets. If the underlying asset prices were to fall sharply, finding buyers might be a challenge, and investors who have to sell may take a sizable loss. Does this mean ETFs have no place in an investment portfolio? Of course not. We think that a well-diversified portfolio may well include a mix of actively managed funds and ETFs-provided that the ETFs are genuinely low cost and passive. We just don’t think those attributes apply to high-yield ETFs. And we suspect that investors who decide to use them as a replacement for active high-yield funds will come to regret it. The views expressed herein do not constitute research, investment advice or trade recommendations and do not necessarily represent the views of all AB portfolio-management teams.

The Right Municipal Bond ETF Right Now

Summary Puerto Rico problems raises concerns in municipal bond space. Take a look at a more conservative muni ETF that targets debt from dedicated revenue streams. Highlight of the Deutsche X-trackers Municipal Infrastructure Revenue Bond ETF. By Todd Shriber & Tom Lydon Chicago. Detroit. Puerto Rico. Increasingly precarious financial positions in those cities and territories and others across the U.S. have cast a pall over the municipal bond market. The cases of Chicago, Detroit and other cities across the U.S., including several mid-sized cities in California, underscore the pressure public pensions and post-employment benefits, such as healthcare for public workers, are putting on state and municipal finances. Those weakening financial positions are prompting advisors and investors to consider alternatives to general obligation bonds when building out the municipal section of fixed income portfolios. There is an exchange traded fund for that and that fund is the Deutsche X-Trackers Municipal Infrastructure Revenue Bond Fund (NYSEArca: RVNU ) . RVNU seeks to limit or reduce exposure to public pension risk, not avoid or eliminate it, by focusing solely on bonds that fund, state and local infrastructure projects such as water and sewer systems, public power systems, toll roads, bridges, tunnels, and many other public use projects where the interest and principal repayments are generated from dedicated revenue sources. Toll roads, tunnels and water systems may not sound like the sexiest investment themes, but with public pension issues afflicting states from New Jersey to Pennsylvania to California, revenue bonds, including those held by RVNU, can be seen as the “new black” of the municipal bond market. “RVNU allows us to offer a product that focuses on investment-grade revenue bonds,” said Deutsche Asset & Wealth Management (Deutsche AWM) Portfolio Manager Blair Ridley in an interview with ETF Trends. “We focus on revenue issuers that by that heir nature usually carry less pension risk as compared to general obligation issuers. We’re trying to follow those issues with dedicated revenue streams, or ‘essential purpose bonds. In any economic environment, people will pay their electric bill and their water bill.” RVNU’s index is intended to track federal tax-exempt municipal bonds that have been issued with the intention of funding, state and local infrastructure projects such as water and sewer systems, public power systems, toll roads, bridges, tunnels, and many other public use projects. The index will attempt to only hold those bonds issued by state and local municipalities where the interest and principal repayments are generated from dedicated revenue sources. A succinct way of highlighting RVNU’s utility in the current municipal bond market environment comes courtesy of Deutsche AWM portfolio manager Ashton Goodfield. She said, “RVNU has less exposure to headline risk. The revenue streams are more stable in up and down economic environments. These revenue streams are what pays back principal and interest on the bonds.” RVNU is just over two years old holds 44 bonds. The ETF’s underlying index, the DBIQ Municipal Infrastructure Revenue Bond Index, holds over 800 bonds. As Ridley notes, RVNU has “a lot of room to add holdings.” RVNU employs a representative sampling methodology in order to match the traits and returns of its underlying index. RVNU has the flexibility to go as far down the ratings spectrum as BBB, but bonds rated either AA or A currently comprise over 86% of RVNU’s index, according to issuer data. At a time of heightened concerns regarding bond liquidity, RVNU ensures liquidity by tilting more than 75% of the fund’s lineup to issues with $100 million or more outstanding. Another obvious concern is rising interest rates and how higher rates will affect longer duration bond funds. RVNU’s index has a modified duration of 6.53 years. That longer duration has been something of a hurdle for RVNU, but one the ETF can easily overcome. “Our focus is on finding the most attractive part of the yield curve,” adds Ridley. “RVNU finds bonds with 10-year calls because those have the same sensitivity as bonds with 10-year maturities.” Since coming to market, RVNU has taken its lumps. The ETF debuted in the midst of the 2013 taper tantrum and the Detroit bankruptcy, but at a time when some of the largest U.S. states, including California and Illinois, are awash in massively under-funded public employee pension obligations, some investors are looking to diversify away from GO bonds while still keeping exposure to munis. “Clients are asking about GOs and pensions,” said Goodfield. “There are some municipalities that aren’t managing these issues well. While true, we think it’s important to say many general obligation issuers are managing these issues well Some investors have a negative outlook and want to be solely in revenue bonds.” As Goodfield notes, awareness of public pension issues is on the rise. That could prove to be good for RVNU over the long-term. Deutsche X-Trackers Municipal Infrastructure Revenue Bond Fund (click to enlarge) Tom Lydon’s clients own shares of RVNU. Disclosure: I/we have no positions in any stocks mentioned, and no plans to initiate any positions within the next 72 hours. (More…) I wrote this article myself, and it expresses my own opinions. I am not receiving compensation for it. I have no business relationship with any company whose stock is mentioned in this article.