Tag Archives: undefined

Adding XIV, Inverse Volatility ETF, Enhances The Performance Of A Stocks And Bonds Portfolio

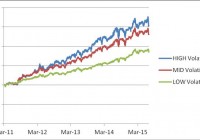
Summary A hypothetical portfolio composed of MDY, QQQ, SHY and TLT performed quite well since its inception in 2003, even during the bear market of 2008-09 and the 2011 market correction. Adding XIV to the portfolio increases the performance range significantly. The enhanced portfolio performed well during the 2011 market correction. In this article we investigate the effect of adding a volatility component to a portfolio of stock and bond ETFs that is known to perform well during market downtrends. We decided to add the VelocityShares Daily Inverse VIX Short-Term ETN (NASDAQ: XIV ), a fund initiated on 11/29/2010. Since XIV historical price data is available only from December 2010 on, and we need 65 trading days for estimating market parameters, we were able to simulate our optimal allocation strategy starting with March 2011. We performed an analysis of the difference in performance of the basic and enhanced portfolios over a 52 months period. Here is the composition of the volatility enhanced portfolio: SPDR S&P Mid-Cap 400 ETF Trust (NYSEARCA: MDY ) PowerShares QQQ Trust ETF (NASDAQ: QQQ ) iShares 1-3 Year Treasury Bond ETF (NYSEARCA: SHY ) iShares 20+ Year Treasury Bond ETF (NYSEARCA: TLT ) VelocityShares Daily Inverse VIX Short-Term ETN ( XIV ) Basic information about the funds was extracted from Yahoo Finance and is shown in table 1. Table 1. Symbol Inception Date Net Assets Yield Category MDY 5/4/1995 17.04B 1.08% Mid-Cap Blend QQQ 3/31/1999 45B 1.01% Technology Large-Cap SHY 7/22/2002 9.17B 0.42% Short Term Treasury Bond TLT 7/22/2002 17.04B 2.70% Long Term Treasury Bond XIV 11/29/2010 497M 0.00% Inverse Volatility The data for the study were downloaded from Yahoo Finance on the Historical Prices menu for MDY, QQQ, SHY, TLT, XIV. We use the daily price data adjusted for dividend payments. The portfolio is managed as dictated by a variance-return optimization algorithm developed on the Modern Portfolio Theory (Markowitz). The allocation is rebalanced monthly at market closing of the first trading day of the month. The optimization algorithm seeks to maximize the return under a constraint on the portfolio risk determined as the standard deviation of daily returns. In table 2 we list the total return, the compound average growth rate (CAGR%), the maximum drawdown (maxDD%), the annual volatility (VOL%), the Sharpe ratio and the Sortino ratio of the volatility enhanced portfolio. We simulated the performance of the portfolio under three targets of the volatility of the returns: low, mid and high. Table 2. Performance of the volatility enhanced portfolio from March 2010 to June 2015   TotRet CAGR NO.trades maxDD VOL Sharpe Sortino LOW risk 84.84% 15.26% 52 -6.90% 9.71% 1.57 2.04 MID risk 130.38% 21.28% 50 -9.83% 13.93% 1.53 2.03 HIGH risk 152.63% 23.89% 50 -12.56% 17.06% 1.40 1.82 SPY 71.93% 13.35% 0 -18.61% 15.15% 0.88 1.11 In figure 1 we show the equity curves for the portfolio with the three targets of the volatility. (click to enlarge) Figure 1. Equity curves for the volatility enhanced portfolio adaptively optimized with a low, mid, and high volatility constraint. Source: This chart is based on calculations using the adjusted daily closing share prices of securities. We also simulated the optimal allocation for maximizing the return without any volatility constraints. The results for the basic portfolio (MDY+QQQ+SHY+TLT) and the volatility enhanced portfolio (same ETFs + XIV), are shown in table 3. Table 3. Performance of portfolios optimized for maximum return without volatility constraints.   TotRet CAGR NO.trades maxDD VOL Sharpe Sortino Basic 113.00% 19.10% 16 -13.83% 15.10% 1.27 1.84 Enhanced 462.22% 49.06% 15 -39.00% 46.53% 1.05 1.22 The equity curves of the portfolios are shown in figure 2. (click to enlarge) Figure 2. Equity curves for the basic and the volatility enhanced portfolio optimized for maximum return without any volatility constraints. Source: This chart is based on calculations using the adjusted daily closing share prices of securities. As can be seen from table 3 and figure 2, the enhanced portfolio can achieve extremely high returns. Those high returns come with a high increase of the volatility of the returns. This behavior is not surprising, given the high volatility of the XIV fund. Fortunately, the XIV fund accumulates gains due to its daily rebalancing while the VIX futures are in contango because it buys the cheaper current month VIX future and it sells the more expensive next month VIX future. Of course, the rebalancing causes losses while the VIX futures are in backwardation. We compared the returns of the portfolios over the bear market of 2008, and the market corrections of 2010 and 2011. The results are shown in table 4. Table 4 Total returns of the portfolios during market downturns Time Period SPY Basic Port. Enhanced Port. 4/2011 – 9/2011 -16.22% 15.09% 11.12% As seen in table 4 both the basic and the enhanced portfolios were profitable during the 2011 market correction. We know that the basic portfolio was profitable during the 2008-09 bear market. We expect that the enhanced portfolio would also perform well, but we do not have historical data to verify it. Conclusion By adding a volatility based fund to a portfolio of stock and bond funds, we obtained a portfolio that is capable of delivering exceptionally high returns during stock bull markets. By allocating the funds based on a return-variance optimization algorithm with volatility constraints, one can achieve high returns with limited down risk during market corrections. Additional disclosure: The article was written for educational purposes and should not be considered as specific investment advice. Disclosure: I am/we are long QQQ,SHY. (More…) I wrote this article myself, and it expresses my own opinions. I am not receiving compensation for it (other than from Seeking Alpha). I have no business relationship with any company whose stock is mentioned in this article.
4 Worst Performing U.S. Equity ETFs So Far In 2015

The U.S. stock market is caught in a bull-bear tug of war this year. On the one hand, the domestic economy has been on a moderate growth path as reflected in increased consumer confidence, higher spending power, renewed optimism in housing recovery and an improving job market. Additionally, a wave of mergers and acquisitions are brightening up the stock world. On the other hand, Fed uncertainty, an aging bull market, lofty stock valuations, strong dollar, lower oil prices, and global growth concerns including Greece crisis and China slowdown are awakening the bear. As a result, both major indices – the S&P 500 and Dow Jones – are in the red territory from a year-to-date look, declining 0.4% and 1.5%, respectively. In fact, a number of products have been crushed by this tug of war, piling up huge losses for many ETFs. Below, we have highlighted four ETFs that have been hit badly in the volatile environment and might continue their rough trading in the months ahead if the same trends persist. C-Tracks ETN on CVOL (NYSEARCA: CVOL ) – Down 41.3% Volatility products have been the biggest laggard this year despite the bouts of volatility seen in the market. This is because these products tend to outperform when markets are falling or fear levels over the future are high, but neither of this has happened lately. While global headwinds tried to dominate the market, upbeat economic data and the Fed continued to fuel a rally at regular intervals. Given this, CVOL – linked to the Citi Volatility Index Total Return – was the hardest hit, having lost over 41% in value so far in the year. The note provides investors direct exposure to the implied volatility of large-cap U.S. stocks. The benchmark combines a daily rolling long exposure to the third and fourth month futures contracts on the CBOE Volatility Index with short exposure to the S&P 500 Total Return Index. The ETN is unpopular and illiquid in the volatility space with AUM of $4.5 million and average daily volume of less than 102,000 shares. It charges a slightly higher 1.15% in annual fees from investors. Market Vectors Coal ETF (NYSEARCA: KOL ) – Down 29.9% Coal has been out of investors’ favor over the past few years on the thriving alternative energy space and weak global industry fundamentals. The depletion of fossil fuel reserves, global warming and high fuel emission issues, new and advanced technologies as well as more efficient applications is making clean power more feasible, reducing the demand for the black diamond. These are making it difficult for the coal miners to sustain their profitability and margins. As a result, the ETF targeting the global coal industry has seen a wild ride and was off nearly 30% so far this year. It tracks the Market Vectors Global Coal Index. Holding 32 securities in the basket, the fund is concentrated on the top 10 holdings at 60.8% of total assets. It definitely has a U.S. focus as roughly 35% of the fund goes to the American stocks. Beyond that, the Asia and Asia-Pacific region combined to make up for 58% share. The fund has amassed $70 million in its asset base and trades in average daily volume of 77,000 shares. Expense ratio came in at 0.59%. KOL has a Zacks ETF Rank of 5 or ‘Strong Sell’ rating, suggesting their continued underperformance in the coming months. SPDR S&P Metals and Mining ETF (NYSEARCA: XME ) – Down 26.6% The other major losers in the equity world year-to-date are the metal & mining stocks and ETFs thanks to plunging metal prices and weak global trends. Acting as leveraged plays on underlying metal prices, metal miners tend to experience huge losses than their bullion cousins in the slumping metal market. In particular, a strong U.S. currency is making dollar-denominated assets more expensive for foreign investors, thereby dulling the appeal for these commodities. The ETF offers broad exposure to the U.S. metal and mining industry by tracking the S&P Metals & Mining Select Industry Index. Holding 34 stocks in its basket, it uses an equal weight methodology and does not put more than 4.53% of assets in a single security. In terms of industrial exposure, steel makes up for large chunk at 42.7%, while diversified metals and mining, aluminum, and coal & consumable fuels round out the next three spots with double-digit allocation each. The product has $263.3 million in AUM and trades in solid trading volumes of nearly 1.9 million shares per day on average. It charges 35 bps in fees and expenses and has lost about 26.6% so far in the year. First Trust ISE-Revere Natural Gas Index ETF (NYSEARCA: FCG ) – Down 22.7% Natural gas has been following the similar path that of the crude oil. After showing some stabilization at the start of the second quarter, the commodity again lost its charm in recent weeks due to a combination of factors. The shale oil boom in the U.S., increased production, supply glut and reduced demand are pushing natural gas prices and the related ETFs lower. FCG, which offers exposure to the U.S. stocks that derive a substantial portion of their revenues from the exploration and production of natural gas, is down nearly 23% in the year-to-date time frame. It follows the ISE-REVERE Natural Gas Index and holds 29 stocks in its basket, which are well spread out across components with none holding more than 4.89% share. The fund has amassed $197.3 million in its asset base while charging 60 bps in annual fees. Volume is good with more than 843,000 shares exchanged per day on average. The ETF has a Zacks ETF Rank of 4 or ‘Sell’ rating with a High risk outlook. Link to the original article on Zacks.com

My Favorite Low Fee ETFs And Mutual Funds For Domestic Equity

Summary Investors should be comparing several options when picking the ETFs or mutual funds they want to use. I’ve collected several of the ETFs that I think are very strong contenders for best of breed status. These ETFs tend to have low expense ratios and offer very diversified domestic exposure. I’m concerned that the market prices are relatively high. While I expect long term prices to go up, I want to protect against short term weakness. Because I’m concerned about weakness in the market, I see SCHD as a top contender among equity non-REIT investments in the domestic market. One of the areas I frequently cover is ETFs. I’ve been a large proponent of investors holding the core of their portfolio in high quality ETFs with very low expense ratios. The same argument can be made for passive mutual funds with very low expense ratios, though there are fewer of those. In this argument I’m doing a quick comparison of several of the ETFs I have covered and explaining what I like and don’t like about each in the current environment. By covering several of these ETFs in the same article I hope to provide some clarity on the relative attractiveness of the ETFs. One reason investors may struggle to reconcile positions is that investments must be compared on a relative basis and the market is constantly changing which will increase and decrease the relative attractiveness. For investors that want to see precisely which assets I’m holding, I opened my portfolio about a week ago. The ETFs (and two mutual funds) I want to cover are indicated below. ETFs and mutual funds for consideration Vanguard Total Stock Market ETF (NYSEARCA: VTI ) Fidelity Spartan® Total Market Index Fund (MUTF: FSTVX ) –I am long every investment above this line– Schwab U.S. Broad Market ETF (NYSEARCA: SCHB ) iShares Russell 3000 ETF (NYSEARCA: IWV ) Schwab U.S. Dividend Equity ETF (NYSEARCA: SCHD ) Vanguard Dividend Appreciation ETF (NYSEARCA: VIG ) When I’m contemplating investing in an ETF, I don’t want to buy a short term holding. At heart, I am a buy and hold investor that is willing to sell most investments only when I become sufficiently bearish. I generally handle rebalancing slowly through allocating new investments to the asset class that needs more strength. However, I don’t rebalance to exact ratios. I follow general rules for the allocation but within reasonable boundaries I will overweight or underweight sectors based on their relative attractiveness. When the market appears overvalued across the board, I reduce my rate of purchase. I still dollar cost into major indexes and I still will allocate some new funds, however I’m also more willing to spend money on doing major projects around the house rather than adding to my investment portfolio. I don’t cut off purchases entirely because I believe the markets will trend to move upwards over time by at least the rate of inflation, which will be much higher than my savings account will pay. Currently I consider the market to be slightly overvalued. Not as overvalued as it was before Greece (which I consider overblown), but the high P/E ratios make domestic investment riskier and the high correlations of international markets combined with the problems in Greece and the problems I expect in China make me concerned about short term international performance. Total and Broad Market VTI and SCHB are total and broad market ETFs. They have a correlation running 99% or higher on returns, so I consider them to be interchangeable. The same can be said for FSTVX though it is a mutual fund. I use mutual funds for an employer sponsored retirement account that is limited to investment in certain mutual funds. I consider these investments to be the best of breed for investors seeking exposure to the total or broad U.S. equity market. Despite my very high opinion of these investments, I feel the market is pushing on being valued too highly and see potential for problems with increases in interest rates expected in September. I’m expecting to see an increase in inflation over the next year or so with higher velocity of money and an increase in inflation may reinforce the decision to slightly increase rates. IWV holds very similar investments and also has very high correlation to the other ETFs listed here, but I expect it to outperform the other options over the long term because of a higher expense ratio. When the assets are very similar, I expect the expense ratios to be a significant factor in the relative performance. Dividend Focused (non-REITs) One of my favorite dividend investments is the Schwab U.S. Dividend Equity ETF. I expect it is one area where I’ll be adding some cash over the rest of the year. SCHD offers an extremely low expense ratio and free trading in Schwab accounts make it an ideal way for an investor to add incremental small levels of exposure. Large cap companies with solid dividends have shown some relative strength in corrections historically and I see the potential for that trend to continue. Aside from funds going into FSTVX for dollar cost averaging, SCHD is easily the strongest contender for receiving additional investments. I’m not long SCHD yet, but I expect to be long on it later this year. Lately SCHD has been weaker than the broad market ETFs, but I think the difference in performance reflects a bullish view by the market. Another solid option for investors wanting diversification in their dividend growth investments is VIG. In my personal rankings VIG has to come below SCHD due to a meaningfully higher expense ratio and a lack of free trading in my accounts. For investors using accounts that have free trading on VIG, it would make more sense for small incremental additions to the portfolio to use VIG rather than SCHD. Conclusion I believe I have selected several best of breed ETFs for investment in the domestic equity market, but I’m becoming less bullish due to high P/E ratios, historically high earnings relative to GDP (raising the denominator in the P/E ratio), and the potential for higher interest rates combined with inflation. While equities do serve as a decent hedge against low rates of inflation, I would be compelled to buy inflation adjusted bonds if they had decent yields. I believe there are plenty of other investors that would also like to be holding more bonds for risk reduction and if decent yields become available I expect it will weigh on stock prices as investors adjust allocations. Some investors may feel that such a situation would hurt dividend stocks and thus dividend ETFs more than other sectors. I’ll take the risks there because a little weakness from raising rates is acceptable to me in exchange for having investments that may not fall as hard if the situation with China and Greece starts hitting the U.S. equity market harder. Disclosure: I am/we are long VTI, FSTVX. (More…) I wrote this article myself, and it expresses my own opinions. I am not receiving compensation for it (other than from Seeking Alpha). I have no business relationship with any company whose stock is mentioned in this article. Additional disclosure: Information in this article represents the opinion of the analyst. All statements are represented as opinions, rather than facts, and should not be construed as advice to buy or sell a security. Ratings of “outperform” and “underperform” reflect the analyst’s estimation of a divergence between the market value for a security and the price that would be appropriate given the potential for risks and returns relative to other securities. The analyst does not know your particular objectives for returns or constraints upon investing. All investors are encouraged to do their own research before making any investment decision. Information is regularly obtained from Yahoo Finance, Google Finance, and SEC Database. If Yahoo, Google, or the SEC database contained faulty or old information it could be incorporated into my analysis.