Tag Archives: undefined

Pioneer High Income Trust’s 45% Premium Looks Ripe For Contraction In 2015

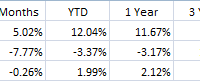
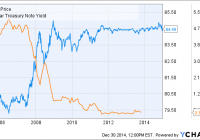
Summary PHT’s 45% premium is three standard deviations above its 1-year average premium. NAV performance has struggled this year, while the market price has increased 12%. 20% of PHT’s portfolio is invested in energy-related securities, increasing the portfolio’s risk. Overview: The Pioneer High Income Trust (NYSE: PHT ) is a high yield bond closed-end fund with a solid track record and a strong management team. High yield funds have struggled recently, as slumping oil prices have raised concerns that highly levered energy companies could default on their debt. Energy companies have been some of the largest issuers of high yield debt in recent years. Expectations of rising interest rates in 2015 have also pressured the high yield market. PHT’s strong performance and high yield have caused shares to trade at a persistent premium since 2009. The fund has a five-year average premium of 23.53%. Recently, the premium has expanded. PHT’s price performance has remained strong, while the underlying NAV performance has struggled along with its high yield peers. The premium has increased to 45.54%. This premium is near the highest ever for this fund and looks vulnerable to a pullback. Key Investment Highlights: High Premium: PHT is currently trading at a 45.54% premium to NAV. This is significantly higher than its 1-year average premium of 29.05% and its 5-year average premium of 23.53%. Evidence of the wider than normal discount, the Z-Statistic of 3.20 shows the current premium is trading more than 3 standard deviations wider than normal. High Yield Performance: Spreads on high yield bonds have contracted as the Fed’s zero interest rate policy has driven investors to reach for yield. Spreads have started to widen as investors contemplate higher interest rates and the potential for increased defaults. These factors have pressured the returns of high yield bonds. PHT’s premium has grown during the years since the financial crisis, driven by consistent strong returns. If returns from high yields are pressured, it is likely PHT’s premium will be pressured as well. Energy Exposure: PHT has significant exposure to energy-related high yield bonds in its portfolio. As of 9/30/2014, 20.02% of the portfolio is invested in energy related holdings. For comparison, the iShares iBoxx High Yield Corporate Bond ETF (NYSEARCA: HYG ) currently has 13.47% of its assets invested in the energy sector. If energy prices remain compressed, PHT’s performance may suffer. Key Investment Risks: Continued Economic Recovery: High yield bonds tend to have strong performance during economic recoveries due to lower default risk. If the economy continues to chug along, high yield bonds may show strong performance, allowing PHT to continue to trade at a significant premium. Energy Price Recovery: A recovery in energy prices would relieve concerns of energy company defaults, allowing energy-related bond prices to recover. Due to PHT’s exposure to energy-related issues a recovery in energy prices would benefit PHT’s NAV performance. Key Portfolio Metrics: Premium/Discount: 45.54% Z-Statistic 3.20 Market Distribution Rate: 9.46% Current Monthly Distribution: $0.1375 Average Earnings/Share: $0.1200 Average Earnings/Distribution: 87.27% UNII Per Share: $0.2238 Effective Leverage: 30.42% Effective Duration: 3.06 Performance: Using ETFs with a similar investment objective can give a good comparison to evaluate management’s performance. HYG is a widely used high yield bond ETF that offers a good comparison for PHT. PHT has a long track record and compares favorably to HYG over the 3- and 5-year periods based on both price and NAV performance. The 10-year track record of 10% per year is attractive and shows the strength of this fund. However, PHT has underperformed over recent time periods likely due to the fund’s riskier holdings and higher energy exposure. The recent divergence between NAV and market performance is what has driven the premium. Data as of 12/26/2014 Source: Morningstar Premium/Discount: (click to enlarge) Source: CEFConnect The fund closed 12/26/2014 at a 45.54% premium to the NAV, or underlying value of the portfolio. This is above the 52-week average premium of 29.05%. The recent divergence between NAV performance and market performance has driven the premium higher. PHT has a strong performance track record that has caused the fund to trade at a persistent premium since 2009. However, the current premium is very high for this fund and investors may want to look elsewhere for their high yield exposure at least until the premium drops down below historical levels. Expense Ratio: PHT pays 0.60% of daily managed assets to Pioneer Investment Management for investment management. The annual expense ratio for PHT as of 3/31/2014 was 1.04. This is a relatively low fee for a high yield closed-end fund. The fee is particularly attractive when considering the strong work that management has done over time. Distribution: PHT pays a monthly distribution of $0.1375/share. The distribution equates to an annual distribution yield of 9.46% based on current market prices and 13.77% based on NAV. PHT’s earnings only cover 87% of the distribution. The fund does have $0.2238 in UNII so the distribution shouldn’t be at risk for a while. If interest rates remain low, PHT may have to reduce its distribution in the future. Leverage: PHT employs leverage through a margin account with Credit Suisse. The fund borrows at three-month LIBOR plus 0.70%. This is a relatively low cost form of leverage in the current market. This does cause concern over the long-term cost of leverage. If interest rates rise, it could increase the cost of leverage to the fund since PHT doesn’t have fixed cost leverage in place. Liquidity: PHT is a moderately sized CEF with $496.37 million in net assets. PHT has 80,000 shares traded on average a day. This represents $1.4 million in daily volume at current prices. This is reasonable liquidity for a CEF and should allow investors to fill orders without problems. It is always wise to use limit orders to purchase or sell shares of closed-end funds, as the bid/ask spread can be wide. Management: PHT is managed by Pioneer Investment Management, a wholly owned subsidiary of UniCredit S.p.A. Pioneer is a well respected fund family with significant fixed income resources and a long track record. The fund appears to be in good hands. Portfolio: Geographic Allocation Source: Pioneer as of 11/30/2014 Most of PHT’s portfolio is based in the United States. PHT has assets invested in several other countries, but none of these countries make up more than 5% of assets. Sector Allocation Source: Pioneer as of 11/30/2014 PHT has broad sector exposure, but the majority of the portfolio is invested in U.S. high yield corporate bonds. One area to watch is the exposure to event-linked bonds. Many of the event-linked bonds in the portfolio are catastrophe bonds. Several of Pioneer’s other funds have significant exposure to catastrophe bonds. These bonds can offer non-correlated high yields, but investors should be conscious of the risks of investing in these bonds. Of particular interest is their non-correlation with high yield bonds. The exposure to catastrophe bonds isn’t high enough to cause concern here, but should be watched to make sure it doesn’t increase over an individual’s risk tolerance. Credit Ratings Source: Pioneer as of 11/30/2014 As would be expected, PHT is mostly invested in high yield bonds. The fund is on the riskier side with 28% of the portfolio invested in CCC rated bonds. Maturity Breakdown Source: Pioneer as of 11/30/2014 The portfolio is invested in relatively short-term bonds. Only 5.7% of the portfolio matures beyond 10 years. The short maturity should help reduce portfolio volatility. However, short maturities increase the risk that yields will not be maintained when proceeds from maturing securities are reinvested. Source: Pioneer as of 11/30/2014 PHT has a diverse portfolio with 363 different securities. The top ten holdings represent only 9.50% of the total portfolio. The portfolio turnover has been low. PHT had a 16% turnover as of 9/30/2014. The highest portfolio turnover in the past five years was 30%. Strategy: PHT’s primary investment objective is to seek high current income with a secondary objective to seek capital appreciation. The fund is able to invest up to 50% of the assets in illiquid securities. The fund is also able to invest in securities of issuers that are in default or that are in bankruptcy. Tax Issues: As of September 30, 2014, the fund had $12,223,142 of net unrealized appreciation in the portfolio. These gains are offset by $46,261,236 in capital loss carryforwards. Conclusion: PHT is a strong fund with capable management. However, the current premium to NAV reduces the attractiveness of the investment at this point. Additionally, portfolio risks don’t appear to be accounted for in the market price. Higher interest rates could pressure high yield returns. The fund’s high exposure to energy related holdings could hurt performance if oil prices remain depressed. If negative NAV performance continues, the fund’s premium would likely erode. This is a fund that I would avoid until there is a significant reduction in the premium.

Why I’m Margin SHY

Summary Margin interest rates at major brokers are several percent. One could instead short SHY at the cost of one half a percent. Tail-risk could make this dangerous. ETF Description SHY is the short-duration treasury ETF managed by iShares. It holds treasuries with a duration between 1 and 3 years. It currently yields 0.46%. It effectively mirrors the behavior of the two year yield. SHY data by YCharts Thesis Below is a table taken from Tradeking of current margin rates at major brokers: One could save substantially by instead shorting SHY. For a hypothetical portfolio which has two dollars of equity for each dollar of margin the current interest charge might be 8%. By lowering that to 0.5% by shorting $1 of SHY for each two dollars of equity, our hypothetical portfolio would perform 3.75% better (on equity). Maintaining this level of out-performance would result in having twice as much money over twenty years! One may also benefit from capital gains because short term yields seem, on balance, more likely to rise than fall over the next ten years or so. Investment Risks Is this a free lunch? I’m honestly not quite certain. On May 6th, 2010 the Dow Jones Industrial average dropped 9% and recovered over the course of minutes. Some stocks, like Procter & Gamble, traded down to a penny. If for some reason there was a flash spike in the value of SHY and your broker forced liquidation, you could be wiped out. It’s hard to quantify the likelihood of such a situation. This is in general a problem of using margin, as a flash crash could wipe you out if your broker forced you to sell at pennies. One might be inclined to think that the risk could be decreased by using multiple short-duration treasury ETFs. This is not the case. It simply adds more danger, because any one of them could theoretically trade at an insane level. The fact that each ETF would represent a smaller amount of money doesn’t help, because it only takes one share trading for $100,000 (as some stocks did during the flash crash) to wipe you out. An important question to ask your broker is what they would do in such a situation. Second, if short-term yields declined further the value of SHY could increase. Suppose that short term interest rates went to negative 3% overnight. If the average duration is roughly two years so if the ETF reflects net asset value the value should increase to something like 6% above par. This would translate to a 6% increase in the ETF’s value. This might be scary if it happens overnight but isn’t much larger than you might have paid for interest over the course of the year. Much larger negative interest rates could cause more significant losses. If we saw short term interest rates go to negative 30% the Net Asset Value of the fund would double. If your broker forces you to sell at that point your losses could be substantial. Third, a deflationary environment might cause a similar problem. The value of short term treasuries might spike. To get a substantial loss (eg. 50%) we’d still need to see something like 17% deflation or 17% negative interest rates. Fourth, if your stock portfolio drops in value you might be forced to sell some positions at depressed values to cover your short position. This is more likely than when using margin! Take the time to calculate how much margin or short SHY you should use under different scenarios. You should at least assume that at some point the US stock market will fall 50%. If it does what will happen to your portfolio? If you are using one dollar of margin per dollar of equity then you are wiped out. Similarly, if you are short one dollar of SHY per dollar of equity you are also wiped out. You might be inclined at this point to say, well alright, I’ll just make sure that my margin/SHY is 49% of the value of my stocks. If this happens, your broker is still likely to force a sale at depressed levels, which could leave you with as little as 2% of your original portfolio value. You need to check what the maintenance requirement for margin is with your broker. For example, at Tradeking the maintenance requirement for stocks above $6 is 30% of the current value. After the drawdown you need to end up with at least 30% equity in your account. This means that you could only have started with a ratio of $2 of equity against $1 of margin to avoid a margin call. Any more margin than this is very risky and over long periods will likely wipe you out. If we handle this instead by shorting SHY the calculation is a little different. The amount of equity can’t (in the case of Tradeking) go below 140% of the market value of SHY. This means that we can only use $1 of shorted SHY for every $4 of equity. Even if you don’t intend to own stocks on margin, but instead use the shorted SHY for something else, you still need to pay attention to this rule. (click to enlarge) I don’t own any stocks on margin, but I am shorting a small amount of SHY to take advantage of a 3% interest rate on a checking account. The maximum amount that I feel comfortable using is 20% of the total stock value of the account.

Crude Oil Price Prospects As Seen By Market-Makers

Summary Oil-price ETFs provide a quick look at expectations for change prospects in Crude Oil commodity prices. Market-maker hedging in these ETFs provide an overlay in terms of their impressions of likely big-money client influences on Oil-based ETF prices. But is there a broader story in price expectations for natural gas? And for ETFs in NatGas, following the same line of reasoning? Change is coming, so is Christmas But in what year? Expert oil industry analyst Richard Zeits in his recent article points out how long prior crude oil price recovery cycles have taken, with knowledgeable perspectives as to why. Still, there is also a suggestion that differences could exist in the present situation. Past cruise-ship price experiences of Crude Oil investors on their VLCC-type vessels have marveled at how long it takes to “change course and speed” in an industry so huge, complex, and geographically pervasive. To expect the navigating agility of an America’s Cup racer is wholly unrealistic. Yet some large part of the industry’s present supply-demand imbalance is being laid at the well-pad of new technology and aggressive new players in the game. In an effort to explore the daisy chain of anticipations that may ultimately be reflected by a persistent directional change in the obvious scorecard of COMEX/ICE market quotes, let’s step back a few paces from the supply~demand balance of commercial spot-market commodity transactions to the futures markets on which are based ETF securities whose prospects for price change attract investors in such volume that ETF markets require help from professional market-makers to commit firm capital to temporary at-risk positions that provide the buyer~seller balance permitting those transactions to take place. But that happens only after the market pros protect their risked capital with hedges in the derivative markets of futures and options, which doing so, quite likely provide some much lesser fine-tuning back into the price contemplations back up the ladder that brought us down to this level of minutia. So where to start? Mr. Zeits regularly asserts that his analyses are not investment recommendations, so securities prices are typically unmentioned, and left to the reader’s cogitation. We will start at the other end, where you can be assured that our thinking is in strong agreement with Mr.Z at his end. We convert (by unchanging, logical systemic means, established well over a decade ago) the market-makers [MMs] hedging actions into explicit price ranges that reflect their willingness to buy price protection than to have their perpetual adversaries in (and of) the marketplace take their capital (perhaps more brutally) from them. Using Richard Z’s list of Oil ETFs, here is a current picture of what the MM’s hedging actions now indicate are the upside price changes possible in the next few (3-4) months that could hurt them if their capital was in short positions. The complement to that, price change possibilities to the downside, could be a yin to the upside move’s yang, but we have found better guidance for the long-position investor’s concern in the actual worst-case price drawdowns during subsequent comparable holding periods to the upside prospects. So this map presents the upside gain potentials on the horizontal scale in the green area at the bottom, with the typical actual downside risk exposure experiences on the vertical red risk scale on the left. The intersection of the two locates the numbered ETFs listed in the blue field. (used with permission) Here’s the cast of characters: [1] is United States Brent Oil ETF (NYSEARCA: BNO ) and PowerShares DB Oil ETF (NYSEARCA: DBO ); [2] is ProShares Ultra Bloomberg Crude Oil ETF (NYSEARCA: UCO ); [3] is United States Short Oil ETF (NYSEARCA: DNO ); [4] is United States 12 month Oil ETF (NYSEARCA: USL ); [5] is ProShares Ultra Short Bloomberg Crude Oil ETF (NYSEARCA: SCO ); and [6] is the iPath S&P GSCI Crude Oil Price Index ETN (NYSEARCA: OIL ). Here is how they differ from one another: All are ETFs except for OIL, an ET Note with trivially higher credit risk and possible slight ultimate transaction problems. All except BNO are based on West Texas Intermediate [wti] crude oil availability and product specs, BNO is based on Brent (North Sea oil) quotes, directly influenced by ex-USA supply and demand balances. Most prices are at spot or most immediate futures price quotes, but USL is an average of the nearest-in-time 12 months futures quotes. All are long-posture investments except for SCO and DNO which are of inverse [short] structure. Both UCO and SCO are structured to have ETF movements daily of 2x the long or short equivalent unleveraged ETFs. What is the Reward~Risk map telling us? For conventional long-position investors, items down and to the right in the green area are attractive, to the extent that their 5 to 1 or better tradeoffs of upside potentials to bad experiences (after similar forecasts) are competitive to alternative choices. The closer any subject is to the lower-left home-plate of zero risk, zero return, the less attractive it is to those not traumatized by bunker mentality. SCO, the 2x leveraged short of WTI crude has a +20% upside with a -16% price drawdown average experience with similar forecasts in the past 5 years. It is a slightly better reward than a bet on a long position in Brent Crude and DNO, whose +18% upside is coupled with only -2% drawdowns. SCO’s minor return advantage over DNO comes largely from its leverage which is responsible for its large risk exposure. The same is true for UCO. USL’s trade-off risk advantage over OIL comes largely from smaller volatility in the 12-month average of futures prices that it tracks, rather than only the “front” or near expiration month. Here are the historical details and the current forecasts behind the map. The layout is in the format used daily in our topTen analysis of our 2,000+ ranked population of stocks and ETFs. For further explanation, check blockdesk.com . (click to enlarge) Conclusion In general, this map suggests that we still have ahead of us some further price declines as crude oil equity investors (via ETFs) see advantages in short structures. The spread between WTI crude price and Brent crude may be as narrow now as is likely in the next few months, given BNO’s relative attractiveness here. This analysis will be followed shortly by a parallel on those ETFs focused on Natural Gas and alternative energy fuels.