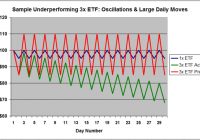
Summary Leveraged ETFs can be dangerous buy-and-hold vehicles due to their extreme volatility and tendency for many to decay over time. However, leveraged ETFs offer the long-term trader an effective means to make a large investment in a particular sector without risking substantial capital, if the position is chosen properly. Leveraged ETFs that trade linearly with small daily intervals and few reversals tend to track their 1x ETF counterparts very well or even outperform on yearly timeframe. This Top-7 list highlights multiple sectors ranging from bonds and currencies to retail to commodities whose leveraged ETFs have outperformed the returns predicted based on their 1x counterparts. Conventional wisdom holds that the leveraged ETFs are the playthings of daytraders, that their volatility and underperformance versus their underlying indices and unleveraged ETFs makes them unsuitable for long-term investing. And there is certainly an element of truth to this – a large number of buy and holds of the 3x leveraged ETFs will end in disaster. However, these ETFs offer the longer-term trader an effective means to make a large investment in a particular sector without risking substantial capital, if the position is chosen properly. This article discusses the top 7 performing 3x leveraged ETFs Relative To Their Indices and corresponding 1x ETF over the last year. These are not necessarily the top overall percent-returning ETFs – a 3x leveraged ETF can double in a year, but if its underlying index was up 50%, that 100% return has to be pretty disappointing. These are the ETFs that best tracked three-times their underlying index, or even outperformed it. Before I go through the list of ETFs, it is first necessary to understand why a leveraged ETF outperforms or underperforms the index that it is designed to track. A leveraged ETF will underperform for three reasons (and therefore outperform when the opposite is true). First, leveraged ETFs that track commodities with a futures market that frequently trades in contango will underperform. These funds must sell near-term futures contracts prior to expiration and use funds from the sale to purchase more-expensive later-period contracts. Sectors that often trade in contango include natural gas and VIX futures where monthly contangos often range from 0.5% to about 3% on average. A 1x ETF such as UNG or VXX will see monthly losses equaling the contango, which can be unfortunate, but not devastating. But 3x ETFs such as UGAZ see losses equal to the contango multiplied by 3, meaning that some months may see as much as a 10% degradation in value of the fund and 40-50% over the course of a typical year. On the other hand, ETFs whose underlying futures trade with a nearly flat futures strip (or, rarely, in backwardation) will see minimal rollover losses on a monthly basis. Such funds include silver, gold, and occasionally oil. Secondly, leveraged ETFs that trade in a sine curve-like pattern with large rallies followed by large corrections tend to underperform versus their underlying index. On the other hand, leveraged ETFs that track indices that trade linearly with small moves in a single direction tend to outperform. The math behind this is complicated, so, I will illustrate this principle with two graphs. Figure 1 below shows a commodity or sector that moves up and down 5% each and everyday, oscillating between 95 and 100 for eternity. The red line shows the predicted movement of the corresponding 3x leveraged ETF while the green line shows what actually happens. After 28 days, the actual ETF is trading at a 20% discount than if the fund truly tracked the ETF on a longer-term 3:1 basis. (click to enlarge) Figure 1: Sample Underperforming Leveraged 3x ETF. Figure 2 on the other hand, shows another sector or 1x ETF that, for a 30-day period gains 1% per day each and every day. After 30 days, this fund is up 31% percent. The 3x ETF would be predicted to be up 93% if it tracked the index 3:1. However, we find that the leveraged ETF actually gains 122%. (click to enlarge) Figure 2: Sample Overperforming Leveraged 3x ETF. Finally, leveraged ETFs outperform their underlying indices and 1x ETFs when the latter suffers large losses. For example, if ETF XYZ loses 50%, the 3x ETF cannot lose 150% of its value and will probably be down 80-90%. This is sort of like winning the battle yet losing the war, so losing ETFs such as these will not be included in the list. With this in mind, onward to the top 7 outperforming 3x ETFs over the last 12 months. Again, these are not necessarily the top performing ETFs (although it sort of turns out that way), but those that best tracked or outperformed, their 1x ETF counterparts. # 7: Nasdaq: TQQQ and QQQ It was a banner year for the Nasdaq with the tech-heavy index up 13.4% and approaching 5000 for the first time since the dot-com bubble burst. The largest component of the 1x ETF PowerShares QQQ Trust (NASDAQ: QQQ ) – Apple (NASDAQ: AAPL ) which comprises 13.6% of the index – hit a new lifetime high in November and two of the other stalwarts in the top 4 – Microsoft (NASDAQ: MSFT ) and Oracle (NYSE: ORCL ) – hit their highest values since the dot-com bubble. Overall, QQQ is up 19.6% over the past year through January 23, 2015. The 3x ETF ProShares UltraPro QQQ (NASDAQ: TQQQ ), on the other hand, is up 58.6% vs. a predicted gain of 58.9% if it were to match QQQ 3:1. This represents almost perfect tracking with a end-of-period underperformance of just 0.3%. Its greatest underperformance during the year was 4% during the large October correction. Figure 3 below shows the performance of QQQ, the predicted performance of TQQQ, and the actual performance of TQQQ. (click to enlarge) Figure 3: 3x ETF TQQQ Actual Performance vs. Predicted Performance vs. 1x ETF QQQ #6: The US Dollar: UUPT and UUP Throughout 2014, the US dollar surged against foreign currencies, gaining nearly 20% versus the Euro, 10% versus the Pound, and about 15% against the Yen. As a result the PowerShares US Dollar Index (NYSEARCA: UUP ) gained 16.7% over the last 12 months. The 3x leveraged ETF PowerShares 3x Long US Dollar Index (NYSEARCA: UUPT ) gained 54.5% vs. a predicted gain of 50.3% during the same period. Thus, the leveraged ETF actually outperformed its underlying index by 3.8%. This outperformance can be explained by a generally linear trend, particularly during the second half of the year, and small mean daily movement and no major reversals with a mean daily change of a measly 0.9% vs. an average of 1.7% among all 62 eligible 3x ETFs. Figure 4 below shows the performance of UUPT vs. UUP vs. predicted performance. (click to enlarge) Figure 4: 3x ETF UUPT Actual Performance vs. Predicted Performance vs. 1x ETF UUP (Source: Yahoo Finance Historical Quotes) #5: Retail: RETL and XRT It was a banner year for retail as holiday sales increased 4% over 2013. The 1x SPDR S&P Retail ETF (NYSEARCA: XRT ) was up 16.6% over the last 12 months driven by all-time highs in major holding CarMax (NYSE: KMX ), and multi-year highs in The Pantry (NASDAQ: PTRY ) and Rite Aid (NYSE: RAD ). The corresponding 3x leveraged product Direxion Daily Retail Bull 3x (NYSEARCA: RETL ) was up 54.7% during the same period vs. a predicted gain of 49.5%, meaning that the leveraged fund outperformed by 5.2%. Figure 5 below shows RETL vs. XRT vs. RETL predicted performance. Of note, while both RETL and XRT are retail ETFs, they do not track the identical index. RETL tracks the Russell 1000 Retail Index while XRT tracks the S&P Retail Index, so it is possible that the two ETFs may vary unrelated to their degree of leverage. (click to enlarge) Figure 5: 3x ETF RETL Actual Performance vs. Predicted Performance vs. 1x ETF XRT (Source: Yahoo Finance Historical Quotes) #4: Healthcare: CURE and XLV The Healthcare Industry enjoyed yet another fantastic year in what is rapidly becoming a 21st century revolution in the medical and pharmaceutical industries. The 1x Health Care SPDR ETF (NYSEARCA: XLV ) has had three consecutive yearly gains of at least 15% and is up 120% since 2010. The ETF has gained 26.2% over the past 12 months bolstered by major holdings Johnson & Johnson (NYSE: JNJ ) and Gilead Sciences (NASDAQ: GILD ), which both hit all-time highs this past year. GILD is up 350% since 2010 on the heels of its blockbuster Hepatitis C drugs Sovaldi and Harvoni, in addition to its highly profitable HIV and Influenza product line. The leveraged Direxion Daily Healthcare 3X ETF (NYSEARCA: CURE ), on the other hand, is up 85.2% over the same period vs. a predicted gain of 78.9%. This equates to an outperformance of 6.3%. Since the leveraged ETF’s start date in mid-2011, the fund has returned a massive 593% vs. a predicted return of 306% for an outperformance of 287%. Figure 6 below shows the 1-year performance of CURE vs. XLV vs. predicted performance. (click to enlarge) Figure 6: 3x ETF CURE Actual Performance vs. Predicted Performance vs. 1x ETF XLV (Source: Yahoo Finance Historical Quotes) #3: 20-Year Bonds: TMF And TLT Thanks to nosediving yields in the face of the impending end of Quantitative Easing, US 20-year treasury bond ETFs have enjoyed their best year since 2008. The 1x iShares 20+ Yr Treasury Bond ETF (NYSEARCA: TLT ) gained 30.0% over the past 12 months. The 3x leveraged Direxion Daily 30-yr Treasury Bull ETF (NYSEARCA: TMF ), on the other hand, gained 108.7% vs. a predicted gain of just 89.8% for an impressive outperformance of 18.9%. Figure 7 below shows the 1-year performance of TMF vs. TLT vs. predicted performance. This is a textbook case of a leveraged ETF outperforming. TLT traded in a generally linear direction from the very start of the period. The leveraged fund had a small average 1.5% daily move which allowed the fund to trend steadily higher with fewer corrections that would eat up the leverage. Indeed, the fund traded higher on average 58.1% of the days over the past year, vs. an average of just 48.7% for all other ETFs. (click to enlarge) Figure 7: 3x ETF TMF Actual Performance vs. Predicted Performance vs. 1x ETF TLT (Source: Yahoo Finance Historical Quotes) #2: Real Estate: DRN and VNQ Boomtimes continued for REITs in 2014 with the 1x Vanguard REIT ETF (NYSEARCA: VNQ ) up 36.0% over the last 12 months. The fund was led by its largest holding Simon Property Group (NYSE: SPG ) – making up 8.3% of the fund – which was up 32% and hit an all-time high for the fourth consecutive year. On the other hand, the 3x leveraged ETF Direxion Daily Real Estate Bull 3x ETF (NYSEARCA: DRN ) gained 137.9% during the same period vs. a predicted gain of 108.2%, an impressive 29.7% outperformance. Figure 8 below shows this in chart form with the 1-year performance of DRN vs. VNQ vs. predicted DRN performance. You will note that for the first two-thirds of the period, VNQ traded slowly higher with only one real correction to note in September and October and therefore DRN tracked the 1x ETF very well 3:1. From October through January to-date, the sector caught fire and VNQ rocketed higher, gaining nearly 30% linearly. It was at this time that DRN really stretched its legs and the 3x leverage really began to work in its favor. (click to enlarge) Figure 8: 3x ETF DRN Actual Performance vs. Predicted Performance vs. 1x ETF VNQ (Source: Yahoo Finance Historical Quotes) #1: Oil: DWTI and USO The first six ETF pairs were all bullish funds. That is, for every 1% that the underlying index rose or fell, the 1x and 3x leveraged product would rise or fall (approximately) 1% and 3%, respectively. For our champion, we see the first inverse ETF on the list. The falling price of crude has been front-and-center news in both the financial and popular spheres over the last five months or so. After sitting near $100/barrel for the past few years, the price of oil has abruptly been slashed in half since June due to an oversupplied market thanks to US shale production and OPEC remaining steadfast on production quotas. As a result the 1x ETF United States Oil Fund (NYSEARCA: USO ) has tumbled 51.0% during the 12-month period ending January 23. On the other hand, the leveraged ETF VelocityShares 3x Inverse Crude product (NYSEARCA: DWTI ) – which is designed to track 3x the opposite of the price of oil – has surged. The ETF has rallied a massive 444.4% during the same period vs. a predicted performance of just 151.3%. This equates to a 293% outperformance. If you were to have sold short $3000 worth of USO last January, you would have profited $1530. On the other hand, if you were to have purchased just $1000 of DWTI, you would have made $4443 and change. Even if you chose a more apples-to-apples comparison using the United States Short Oil Fund (NYSEARCA: DNO ), which is designed to track 1x the inverse of the price of oil, DWTI still outperformed by 182% given that DNO rose just 86.9% during the 12-month period and predicted only a 260.1% rally in DWTI. Figure 9 below shows the 12-month performance of USO vs. actual performance of DWTI vs. predicted performance of DWTI. (click to enlarge) Figure 9: 3x ETF DWTI Actual Performance vs. Predicted Performance vs. 1x ETF USO (Source: Yahoo Finance Historical Quotes) Why did DWTI so dramatically outperform its commodity and USO? Due to minimal contango/backwardation in the absence of major price swings through June, DWTI tracked its predicted change based on USO very well, never underperforming by more than 10%. And then come September when oil really began to swandive, it did so quickly, relentlessly, and in large intervals which based on the discussion at the beginning of this article, includes all of the ingredients for a major outperformance of the leveraged ETFs. Table 1 Below shows a summarization of the Top 7 Outperforming ETFs discussed above. Table 1: Summary of top outperforming leveraged ETFs. In conclusion, this article is not intended necessarily to be a shopping list for outperforming leveraged ETFs as past performance does not equal future returns – even if several such as DRN, CURE, and TMF have a multi-year history of outperformance. Rather it is intended also to be a 7-part case study in how to invest in leveraged products without suffering the gradual decay seen in many of the 3x ETFs. I do not currently have a position in any of these positions currently, having closed out my DWTI a few weeks ago. I am considering opening a position in CURE on a pullback in the next couple of weeks. Stay tuned next week for a follow-up article discussing the Bottom 10 underperforming leveraged ETFs.