Tag Archives: undefined

Dow 20,000: Is 2015 The Year?

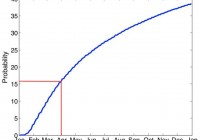
Jeremy Siegel suspects the Dow might hit 20,000 in 2015. There is a (unconditional) 38.6% chance that the Dow closes out 2015 above 20,000. Find out the probability that the Dow will close above 20,000 any day during the year in the analysis below. It’s that time of year again. Yup, that jolly, happy time of year when the soothsayers of Wall Street start trumpeting their views on what’s going to happen in 2015, and how to position portfolios to profit. Esteemed Wharton professor, Jeremy Siegel, author of the permabull bible, Stocks for the Long Run , recently joined the merry parade with his own forecast that Dow 20,000 ‘could happen’ in 2015. Astute investors might take stakes now in large manufacturers of confetti, party horns, and streamers. But I digress. We don’t make forecasts on this blog, but it is constructive to understand generally what the range of probable outcomes might be. Is our hero, Dr. Siegel, taking a brave stand against the bearish hordes, or is he making safe proclamations from behind a sturdy statistical moat? We aim to find out. First, the low hanging fruit. What is the unconditional probability that the Dow Jones Industrial Average, which closed 2014 near 18,000, closes out 2015 above 20,000? First, let’s assume that returns are normally distributed and iid . Next, let’s take long-term average (arithmetic) U.S. stock returns to be 5.3% per year (this is the average 12 month arithmetic price-only returns to U.S. stocks from the Shiller worksheet – remember, index returns do not include dividends), with annual standard deviation of 20%. If the mean annual return to the price index is 5.3%, then the unbiased expected value of the Dow at the end of 2015 is 18,000 * 1.053= 18,950. A finish at 20,000 would represent a return of 20,000/18,000 = 0.111 or 11.1%, which is 11.1% – 5.3% = 5.8% more than expected. Given the standard deviation of returns is 20%, this represents a 5.8/20 = 0.29 standard deviation event. We can now apply the cumulative normal distribution function to determine the probability of a positive 0.29 sd event. In Excel, it is 1 – NORM.S.DIST(0.29,TRUE) = 0.386, or 38.6% So the unconditional probability that the Dow closes at 20,000 or greater at the close on the last trading day of 2015 is almost 40%. This is not quite a coin toss, but Jeremy is not exactly going out on a limb. Keep in mind that stock market price returns approximate a geometric random process. They don’t just climb in a steady curve, and close each day at a new high. Surely Jeremy would take credit for his “Dow 20,000″ call if the index exceeds the magical 20,000 threshold at any point during the year, even if it doesn’t actually finish the year above this level. For simplicity however, let’s just examine the probability that it closes above 20,000 on any trading day of the year; so we won’t take into account intra-day periods. Recall that if the annualized return is 10%, then the expected return at the close on day 1 is (using a 252 trading day year): 1.053^(1/252)-1 = 0.0002, or 0.02% with a range of 20% * sqrt(1/252), or 1.26% Were the Dow to close at 20,000 on trading day 1, that would represent an 11.1% return in 1 day. Given the 1 day expected return is 0.02%, with a 1 day SD of 1.26%, this would be a (0.111 – 0.0002) / 0.0126 = 8.8 standard deviation event. The probability of a positive 8.8 sd event under a normal sample distribution is a decimal number preceded by 20 zeroes. Essentially no chance. But that’s just on day 1. What about on day 63, which is about 3 months into the year? The expected return after 63 days is 1.053^(63/252)-1 = 1.3%, with a standard deviation of 20% * sqrt(63/252) = 10%. Were the Dow to have risen 11.1% to close at 20,000 on trading day 63 (about the end of March), that would represent a (0.11 – 0.013)/0.1 = 0.98 standard deviation event. The probability of a positive 0.98 standard deviation event is about 16.3%. Now we are talking a 1 in 6 chance that the Dow hits 20,000 at the end of March, the same odds as throwing a 6 on a standard die. The following chart was formed by performing essentially the same analysis at each daily period, and shows the probability that the Dow will meet or exceed 20,000 at the close of each sequential trading day of the year. We highlighted the 16.3% probability at a 3 month horizon described above for illustrative purposes. Figure 1. Probability of Dow > 20,000 at each sequential trading day of 2015 (click to enlarge) We now know the probability of the Dow closing above 20,000 on any given day, but we still haven’t answered the question, “What is the probability that the Dow closes at or above 20,000 at any time in 2015?” To answer this, first consider Figure 2, which shows just 20 of the virtually infinite number of possible paths for the Dow over the next year, given our mean return and standard deviation assumptions. Figure 2. Sample paths for the Dow in 2015 (click to enlarge) By visual inspection we can see that a substantial portion of the potential paths in Figure 2 cross above 20,000 at some point during the year. We ran a Monte Carlo simulation of 1 million possible paths, and discovered that about 64% of paths would cause the index to rise above 20,000 at some point during the calendar year. Particularly astute readers may recognize that the former problem, where we solved for the probability of a price exceeding a specific value at a certain point in time, is a problem of similar nature to that of solving for the value of a European call option, which can be exercised only at expiration. This problem has a known closed-form analytical solution. In contrast, the latter problem has elements that are similar to finding the value of an American call option, which can be exercised at any time up to and including expiration. This problem has no known closed-form solution, and must be solved numerically or by simulation, such as our Monte Carlo method. It’s critical to understand the random element in stock market activity so that we don’t get so emotionally attached to silly milestones. There is a 64% chance that the media and the top 0.01% will be able to break out party hats and champagne this year to celebrate an arbitrary milestone in a poorly constructed index. Siegel isn’t making a bold statement; far from it. Rather, he is playing the (unconditional) odds. And that is precisely what you should do as an investor. The question is: do you feel lucky? We can think of a few reasons why you shouldn’t feel so sanguine, and might humbly suggest a better way of thinking about markets anyway.

Cyber Warfare Risk: What Are The Investment Impacts?

by Ron D’Vari The devastating cyber-attack against Sony and its allegedly state-sponsored origins raises several key questions with respect to the security risk for the global financial system. For example: Should investors be worried about advanced threats on the global financial system by cyber terrorists and/or state-sponsored adversaries to destabilize the global economy and markets? Could there be attacks on the Federal Reserve, the U.S. Treasury or one or more mega banks of a magnitude that would destabilize the U.S. dollar and prompt a global stock market collapse? Do U.S. monetary and fiscal policies render this type of cyber threat potentially more devastating? In what ways could the cyber-threat to the financial system affect the relative attractiveness of “real assets” (real estate, physical commodities, infrastructure investments, etc.) vs. “financial assets” (enterprise value-related assets)? U.S. intelligence agencies as well as major companies are gradually waking up to the critical nature of cyber security to systemic financial stability. Indeed, the financial services industry has already recognized it can no longer work in isolation, marked by the formation of a member-owned non-profit entity, the Financial Services Information Sharing & Analysis Center (FS-ISAC), to provide resources for cyber and physical threat intelligence analysis and to share information about hackings. The U.S. government has not yet developed a unified approach to help companies coordinate a response to an attack and share information. Complications and lack of coordination in the Sony case made that obvious. As a result, the government is expected to sharpen its focus on this. Companies and government agencies will be investing large sums of money in innovative encryption and firewall solutions to make data, Internet and payment systems safer. Cyber war games have already been created as a way to test a company’s response to cyber incidents. The net effect will be positive for investments in the cyber security industry, but may also lower the overall profitability and productivity of the economy in aggregate. Financial advisers have already been warming to real assets as stock market volatility has picked up and demand for a long stream of cash flows by pension funds has increased. With increasing incidents of cyber-attacks, the trend is expected to continue. There will naturally be a slew of litigations in high-profile data breaches and operation interruptions. These will include claims by employees, customers, suppliers and shareholders. Shareholders can sue if a breach affects share values and future financial streams. Now that you’ve read this, are you Bullish or Bearish on ? Bullish Bearish Sentiment on ( ) Thanks for sharing your thoughts. Why are you ? Submit & View Results Skip to results » Share this article with a colleague

NUO Offers Some Decent Yields, But I Have Several Concerns About It

Summary I’m taking a look at NUO as a candidate for inclusion in my ETF portfolio. I don’t like the expense ratio. The correlation to SPY is almost nothing and it is based on reasonable trade volumes. The credit ratings of the portfolio seem fine, but the high duration and persistent discount to NAV concern me. I’m not assessing any tax impacts. Investors should check their own situation for tax exposure. Investors should be seeking to improve their risk adjusted returns. I’m a big fan of using ETFs to achieve the risk adjusted returns relative to the portfolios that a normal investor can generate for themselves after trading costs. I’m working on building a new portfolio and I’m going to be analyzing several of the ETFs that I am considering for my personal portfolio. One of the funds that I’m considering is the Nuveen Ohio Quality Income Municipal Fund (NYSE: NUO ). I’ll be performing a substantial portion of my analysis along the lines of modern portfolio theory, so my goal is to find ways to minimize costs while achieving diversification to reduce my risk level. What does NUO do? NUO attempts to provide current income that is exempted from regular federal and Ohio income tax. At least 80% of the assets are invested in investment grade municipal bonds. The other 20% may be invested in bonds that are not rated if the investment adviser believes their characteristics are similar to those of investment grade municipal bonds. NUO falls under the category of “Muni Ohio.” Does NUO provide diversification benefits to a portfolio? Each investor may hold a different portfolio, but I use the SPDR S&P 500 Trust ETF (NYSEARCA: SPY ) as the basis for my analysis. I believe SPY, or another large cap U.S. fund with similar properties, represents the reasonable first step for many investors designing an ETF portfolio. Therefore, I start my diversification analysis by seeing how it works with SPY. I start with an ANOVA table: (click to enlarge) The correlation is beautiful at 3%. Extremely low levels of correlation are wonderful for establishing a more stable portfolio. For equity securities an extremely low correlation is frequently only found when there are substantial issues with trading volumes that may distort the statistics. Bonds should have dramatically lower levels of correlation, but I’m still quite happy with this. NUO is an ETF that is heavily invested in bonds, so the low correlation for it should be less surprising than a similar correlation from an ETF that is invested in equity. Standard deviation of daily returns (dividend adjusted, measured since January 2012) The standard deviation is .6859% for NUO. For SPY, it is .7300% for the same period. SPY usually beats other ETFs in this regard. However, I would have hoped for a little less volatility. The real test for a bond portfolio is looking at the duration and seeing how vulnerable it is to changes in interest rates. Liquidity looks acceptable Average trading volume isn’t very high, a bit over 22,000, but that also isn’t low enough to be a major concern for me. It is higher than I had expected when I saw the low correlation and saw that the bond was being designed for tax exemption for a single state. I thought liquidity might be weaker because of the more specialized nature of the ETF, but it isn’t too bad in my opinion. In my sample period of nearly 3 years, there were no days in which the dividend adjusted close was exactly equal to the value it had on the previous day. The lack of days with no change suggests that low liquidity is not driving the low correlation. Mixing it with SPY I also run comparisons on the standard deviation of daily returns for the portfolio assuming that the portfolio is combined with the S&P 500. For research, I assume daily rebalancing because it dramatically simplifies the math. With a 50/50 weighting in a portfolio holding only SPY and NUO, the standard deviation of daily returns across the entire portfolio is .5082%. With 80% in SPY and 20% in NUO, the standard deviation of the portfolio would have been .6038%. If an investor wanted to use NUO as a supplement to their portfolio, the standard deviation across the portfolio with 95% in SPY and 5% in NUO would have been .6954%. Why I use standard deviation of daily returns I don’t believe historical returns have predictive power for future returns, but I do believe historical values for standard deviations of returns relative to other ETFs have some predictive power on future risks and correlations. Yield & Taxes The distribution rate is 5.72%. This ETF could be worth considering for retiring investors. I like to see strong yields for retiring portfolios because I don’t want to touch the principal. By investing in ETFs I’m removing some of the human emotions, such as panic. Since this is an investment in bonds through an ETF, over the long term capital appreciation should not be expected. In my opinion, investing in SPY provides a reasonable level of dividend yield with a substantial amount of average appreciation over time. For a retiring investor, it may be desirable to have stronger yields at the cost of appreciation. One way to do that is to include some bond ETFs. I intend to include quite a few of them in my portfolio. The exposure level will probably be in the 20 to 30% range. Some advisors would suggest that I should have fewer bonds since I am so far away from retirement, but I believe the lower correlation makes it imperative to include at least a small bond position in reaching the efficient frontier. I’m not a CPA or CFP, so I’m not assessing any tax impacts. The description of the ETF states that it intends to produce income that is exempt from taxation in Ohio, but I am not qualified to determine if that goal is being met. The portfolio I am constructed will be in a tax advantaged account, so I am not concerned about avoiding taxes on interest, dividends, or gains. Expense Ratio The ETF is posting 2.15 % for a gross expense ratio, and 1.10% for a net expense ratio. I want diversification, I want stability, and I don’t want to pay for them. This is what I would consider an unattractive expense ratio. Market to NAV The ETF is at a 9.66% discount to NAV currently. Premiums or discounts to NAV can change very quickly so investors should check prior to putting in an order. Over the last month the average discount was 9.56% and over the last year it was 6.78%. I’m curious about the reason for that substantial discount. Normally I would expect fair market values for the individual investments used in calculating NAV, but I’m curious about this one. It may be fun to look for anything that would merit that discount. Credit Ratings The bond ratings aren’t too bad in my opinion, but I’m also currently holding a fund filled with junk bonds. Many readers may have much higher requirements for credit ratings when investing in debt. (click to enlarge) Conclusion I’m currently screening a large volume of ETFs for my own portfolio. The portfolio I’m building is through Schwab. I have a strong preference for researching ETFs that are free to trade in my account, so most of my research will be on ETFs that fall under the “ETF OneSource” program. I have not seen this ETF listed for the OneSource program. I love the correlation, but I’ll need to test the correlation with other bond ETFs as I work to select a batch of bond ETFs that are neither highly correlated to the market nor to each other. I do have a few major concerns here. The first is that I don’t want to give up any yield to acquire tax free status on bonds that are going into a tax advantaged account. The second is that the expense ratio feels really high. The third is that discount to NAV is both substantial and sustained, so I would want to find the cause of the discount. The fourth is that the average effective duration is 8.84 years. One of the reasons I use junk bonds is so I can acquire a respectable yield while maintaining a substantially lower duration. I’m not expecting NUO to make the final cut, but I’m going to keep on my list because I want to see how it performs relative to other bond ETFs in the portfolio simulations. Additional disclosure: Information in this article represents the opinion of the analyst. All statements are represented as opinions, rather than facts, and should not be construed as advice to buy or sell a security. Ratings of “outperform” and “underperform” reflect the analyst’s estimation of a divergence between the market value for a security and the price that would be appropriate given the potential for risks and returns relative to other securities. The analyst does not know your particular objectives for returns or constraints upon investing. All investors are encouraged to do their own research before making any investment decision. Information is regularly obtained from Yahoo Finance, Google Finance, and SEC Database. If Yahoo, Google, or the SEC database contained faulty or old information it could be incorporated into my analysis. The analyst holds a diversified portfolio including mutual funds or index funds which may include a small long exposure to the stock.