Equity CEFs: Global CEFs For A QE Europe
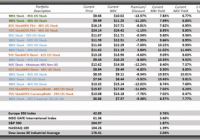
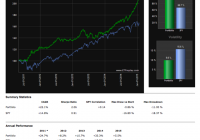
Summary After years of lagging the US markets, will Quantitative Easing by the European Central Bank inflate the European stock markets much like the Federal Reserve did for US markets? That seems to be the central question as the ECB begins its own QE bond buying program designed to help stimulate the Eurozone economies. And if the ECB is successful, then what global equity CEFs might benefit as well? If Quantitative Easing – Europe style helps European stocks much like Quantitative Easing – USA helped our equity markets, then it stands to reason that global equity based CEFs that have a high exposure to European stocks might benefit as well. Though I am not familiar with any equity CEFs that are pure European stock focused, i.e. follow an index that includes the largest and most popular European stocks like an S&P 500, you can certainly find equity CEFs that have a large percentage of their portfolios, typically around 25% to 35%, exposed to the large cap European stock markets. This is in contrast to the Asia/Pacific region in which there are quite a number of equity CEFs dedicated entirely to stocks in these markets, whether they be general equity CEFs, emerging market CEFs or more country specific CEFs. The theory, however, is that any QE – Europe would probably benefit the largest and most liquid European stock names and thus investors should focus on equity CEFs that include these securities as part of their overall portfolio. There are also several ETFs, such as the popular iShares Europe fund (NYSEARCA: IEV ) , that will give you a pure play on the largest and most popular European stocks as a non-managed index fund, but I personally like the global equity CEF approach since not only are many of these funds trading at wide discounts and are at the low end of their discount/premium range, but they also are diversified so that you don’t put all your eggs in one basket in case QE – Europe doesn’t have quite the same effect as QE – USA. Most of the global equity CEFs I follow are diversified among the US, Europe and Asia/Pacific markets and can also offer varying income strategies that help pay for their large yields, generally in the 7% to as high as 11%. For example, leveraged income global equity CEFs will often include fixed-income securities such as preferreds or corporate bonds to reduce volatility and provide further diversification to protect against any one sector underperforming. After all, we’re not looking for home runs in these funds but rather relative outperformance over their CEF and ETF counterparts. So if you want the pure play European stock approach, then IEV or some other European stock focused ETF is probably a better way to go. But as you’ll see, diversification has its merits and many of these global equity CEFs have outperformed, both at the NAV and market price levels – the most popular international ETFs such as IEV or the more broadly based iShares Morgan Stanley EAFE international index (NYSEARCA: EFA ) , which includes Europe, Asia and the Far East stock markets, hence the EAFE. Global Equity CEF 1-Year and 3-Year Performances The following two tables sorts the global equity CEFs I follow by their total return NAV performances over one-year and then three years (through January 23rd so a little longer than one-year and three-ye ar periods). All of these funds have roughly 25% – 35% large cap European stock exposure though most will still have a higher exposure to US markets and some may be more Asia/Pacific stock weighted than European stock weighted. What are not included in the tables are global equity CEFs that focus in emerging markets are country specific or sector specific funds such as global utilities or global REITs. In other words, I’m just including global equity CEFs that may be beneficiaries of any QE – Europe due to their large cap European stock exposure. Also included at the bottom of each table are the total return ETF performances of the most popular international ETFs, IEV and EFA , and from the US major market indices, the SPDR S&P 500 (NYSEARCA: SPY ) , the Powershares NASDAQ-100 (NASDAQ: QQQ ) , the SPDR Dow Jones 30 Industrials (NYSEARCA: DIA ) . 1-Year Total Return Performance 3-Year Total Return Performance Recommended Global Equity CEFs For QE – Europe Using the tables above and other proprietary information regarding relative valuations and historic NAV performance, these are the global equity based CEFs with European stock exposure that I would recommend. First is the Eaton Vance Tax-Advantaged Global Dividend Income fund (NYSE: ETG ) , $16.15 market price, $17.71 NAV, -8.8% discount, 7.7% current market yield . ETG , along with (NYSE: ETO ) , are Eaton Vance’s two global leveraged equity based CEFs that also include about 20% of their portfolios in fixed-income preferred securities. Both of these funds, along with (NYSE: EVT ) , which is Eaton Vance’s leveraged US based CEF, are higher risk, higher reward CEFs due to their use of leverage but all have been fantastic performers over the past few years both at the NAV and market price level. ETG used to have the highest valuation of all of the Eaton Vance leveraged CEFs but currently trades at a -8.8% discount, at the low end of its Premium/Discount range as shown in this 3-year Premium/Discount chart. (click to enlarge) ETG includes about 32% of its portfolio in large cap European stocks, 7% exposure in Asia/Pacific and the rest mostly in US based large-cap stocks. ETG’s overall portfolio is 82% equities and 18% preferred securities. I have followed ETG for years and I often used it as a short hedge against my long CEF positions as the fund would often spike up to trade close to a premium valuation for short periods only to drop back to a wider discount. For investors who think that CEFs don’t stray much from their premium/discount valuations over time, ETG is a good example of a fund that does. Eaton Vance’s other leveraged global equity CEF, ETO is similar to ETG but trades at a much narrower and even historically narrow -1.2% discount due to recent distribution increases and very large capital gain distributions over the last couple years. Frankly though, both of these funds have knocked the cover off the ball the last few years even with their global stock exposure and have far outperformed IEV or EFA at both the NAV and market price levels. Referring to the tables above, ETG has returned 62.4% to investors at its market price in a little over three years while ETO has returned a whopping 81.6% . Have The Alpine CEFs Finally Turned The Corner? Well, I never thought I would say this but the second group of global equity CEFs I would recommend to take advantage of a European market turnaround are the Alpine Total Dynamic Dividend fund (NYSE: AOD ) , $8.66 market price, $10.02 NAV, -13.6% discount, 7.8% current market yield and the Alpine Global Dynamic Dividend fund (NYSE: AGD ) , $9.99 market price, $11.25 NAV, -11.2% discount, 7.7% current market yield . For those of you who have followed my articles over the years, you know that I had been one of Alpine’s biggest bears ever since I started writing on Seeking Alpha due to the two fund’s ineffective dividend harvest income strategy that dramatically eroded the fund’s NAVs over the years while overpaying their distributions. Alpine finally got the message a couple years ago and brought in new portfolio managers who first took steps to minimize the use of their dividend harvest strategy while significantly reducing the distributions to a more reasonable NAV yield. Then just a year ago, Alpine implemented a reverse split (not their first) for the two funds to boost up their depressed NAV prices. Though this was tough medicine to take and the funds still reflect some of the worst NAV and market price performances of any equity CEFs since their inceptions in 2006 and 2007, it’s safe to say that the funds have finally turned it around and are seeing a resurgence in their NAV performances. Though AGD is considered the global of the two funds, the fact is both funds have similar portfolios and similar exposure to European equities, with AGD showing 32% of its portfolio in European stocks, 55% in US stocks and about 11% in Asia/Pacific while AOD’s portfolio breakdown is 29% in European stocks, 58% in US stocks and 11% in Asia/Pacific (as of 10/31/2014). Though the funds rely less on a dividend capture income strategy now and have much more achievable NAV yields of about 6.8% instead of the 12%+ NAV yields they use to have, there still seems to be hesitation by investors as to whether the funds have actually turned the corner. This is reflected in the fund’s wide discounts with AGD at a current -11.2% discount and AOD at one of the widest discounts of all equity CEFs at -13.6%. But this is where the opportunities lie because investors were wrong in their zeal for AGD and AOD several years ago (as I pointed out in many articles) when investors drove the fund’s valuations up to market price premiums as high as 50% in early 2010 and I believe they are wrong now as the fund’s drop to double digit discounts just at a time when their improved income and growth strategies could really start to pay off. A Global Equity CEF With The Highest European Exposure The last global equity CEF I am recommending is also one I used to pan because of its high valuation and lackluster NAV performance, but it also has one of the highest exposures to large cap European stocks if you believe the time is now for this region to outperform. The Voya International High Dividend Equity Income fund (NYSE: IID ) , $7.94 market price, $8.44 NAV, -5.9% discount, 10.4% current market yield targets 50% of its portfolio to be invested in European stocks, 40% in the Asia/Pacific region and only about 9% in US stocks. This minimal exposure to the US markets has resulted in IID’s severe NAV and market price underperformance over the last few years though the fund has continued to maintain a high NAV yield and offer an extremely generous market price yield, currently 10.4% paid monthly, even in the face of this underperformance. Some might argue that this is still too generous as the fund’s NAV yield of 9.8% will not be easy to achieve for an option-income CEF that targets a fairly low 20% – 50% of its portfolio to write options against. In other words, IID will need a lot more portfolio appreciation going forward if it wants to continue to pay out that high of an NAV yield. Because the alternative is continued NAV erosion and a diminishing asset base, which makes it that much more difficult to sustain the current distribution. I personally would feel even better about IID’s turnaround prospects if Voya cut the distribution to a more attainable 7% – 8% NAV yield because if the QE – Europe effect doesn’t play out, then Voya will probably have to take that step. IID , like ETG , is another fund that can vary widely in its valuation, going from a market price premium to a market price discount in a matter of weeks as seen in this three-y ear Premium/Discount graph. (click to enlarge) As you can see, IID’s current -5.9% discount is at the bottom of its range for a fund that typically can trade at a market price premium. Though IID is certainly not the most undervalued global equity CEF even at the bottom of its discount range, one reason why it trades at such a high relative valuation is because of its appreciation potential. Because if the international markets like Europe start to play catch up with the US markets, then IID is one of the best high risk/high reward equity CEFs to take advantage of that. Conclusion All of these fund’s portfolios can be seen at their fund sponsor’s websites and this analysis does not take into account a fund’s actual stock holdings though there tends to be a lot of overlap in the large-cap international stocks these funds own. In addition, most of these global equity CEFs use hedging strategies to reduce currency risk and the effectiveness of these strategies is also not taken into consideration. But if you believe that QE – Europe has the potential to do for large-cap European stocks what QE – USA did for our markets, then these global equity CEFs, offering low valuations and high yields, could be an excellent way to play off that effect.