Tag Archives: undefined

High Yield Dividend ETFs – A Tale Of The Tape

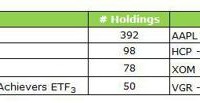
Summary These high-yield dividend ETFs offer greater yield than S&P 500. ETFs offer greater diversification than individual stocks. Unlike mutual funds, ETFs can be traded throughout the day. “Do you know the only thing that gives me pleasure? It’s to see my dividends coming in.” – John D. Rockefeller (as quoted by John Lewis in Cosmopolitan) Dividends are a beautiful thing. They are the portion of earnings that the board of directors decides to pay to shareholders. You can use dividends to purchase additional shares under a dividend reinvestment plan, have them deposited back into your brokerage account, or sent to you in the form of a check. While some view dividend paying companies as less risky than those who reinvest all earnings, others see dividends as an illusion, arguing that dividends are not tax efficient and pointing out that removing capital from a company could impact future profits or earnings ability. I view dividends as an amusing consequence of investing in companies that generally produce more cash than they need to fund ongoing operations. While I prefer dividend paying companies to non-payers, my bias is generally routed in the emotional side of personal finance and investing rather than some fundamental thesis that a portfolio of dividend payers is superior to the alternative. Much is said on Seeking Alpha about dividends and dividend paying stocks. But far less is said about their better diversified and arguably more fundamentally sound counterparts, dividend-oriented ETFs. I think most people like to own individual stocks rather than ETFs because it makes them feel they are somehow more connected to their investing strategy. They can read earnings releases, pore over 10-Qs and 10-Ks, lament on insider trading, and all the other things that investors like to do to feel a connection to their portfolio. In this article I will give up those dividend investing birthrights, and take a comprehensive and quantitative approach to analyzing four “high-yield” dividend ETFs to determine if the hands off approach has the merits fundamentally embedded ETF investing. Profiling the contenders (unless otherwise stated, market prices, NAV and SEC yield as of 1/23/15) : Vanguard High Dividend Yield ETF (NYSEARCA: VYM ) This ETF seeks to track the performance of the FTSE High Dividend Yield Index, which measures the investment return of common stocks of companies characterized by high dividend yield. Market price: $68.74 30-day SEC Yield: 2.93% Number of holdings: 392 iShares Core High Dividend ETF (NYSEARCA: HDV ) This ETF seeks to track the investment results of an index composed of relatively high dividend paying U.S. equities. Market price: $77.34 30-day SEC Yield: 3.45% Number of holdings: 78 Powershares High Yield Equity Dividend Achievers Portfolio ETF (NYSEARCA: PEY ) This ETF is based on the NASDAQ US Dividend Achievers 50 Index and will normally invest at least 90% of its total assets in dividend paying stocks that comprise the index. Market price: $13.51 30-day SEC Yield: 3.21% Number of holdings: 50 SPDR S&P Dividend ETF (NYSEARCA: SDY ) This ETF seeks to provide investment results that, before fees and expenses, correspond generally to the total return performance of the S&P 500 High Yield Dividend Aristocrats Index. Market price $79.32 30-day SEC Yield: 2.19% Number of holdings: 98 1) Diversification Diversification is the process of reducing non-systematic risk by investing in a variety of assets or asset classes that (hopefully) do not move up or down in value at the same time or magnitude. As the 2008 financial crisis taught us , there are certain unforeseeable events (think global recession, world wars) that no amount of diversification can protect us from. Despite this qualifier, I still prefer the perceived spreading of risk as opposed to the all-eggs-in-one-basket watched very closely mentality. a) Number of holdings While more isn’t necessarily better, too little can be not enough. In general, there are eight sectors or broad categories of businesses: Basic Materials, Services, Conglomerates, Consumer Goods, Financial, Technology, Healthcare, Industrial Goods and Utilities. Within each sector is a number of industries (Consumer Goods includes beverages and office supplies, Services includes auto dealerships and airlines). According to Yahoo, there are roughly 190 industry categories . An ETF need not be comprised of companies in every industry, since certain common economic factors are primary drivers across unrelated industries. Think general contractors and residential builders performing well during a housing boom. (click to enlarge) Winner : Vanguard’s quantity of holdings is sufficient to represent an investment in every major industry category nearly twice over. While it has a hefty stake in Apple, which is tough to call high yielding at less than 2% , it still has a broad base of companies that is almost four times larger than the runner up, SPDR. b) Sector Representation Vanguard High Dividend Yield Sector Allocation (Courtesy of Vanguard) iShares Core High Dividend Yield Sector Allocation (Courtesy of Blackrock) Powershares High Yield Equity Dividend Achievers (Courtesy of Invesco) SPDR S&P Dividend ETF Sector Allocation (Courtesy of State Street Global Advisors) Winner: Vanguard. All three other funds have at least 20% of their holdings concentrated in a single sector. Not so for Vanguard, who limits their sector exposure to 18.10%. What is interesting to note, and should be reviewed by investors based on their own personal preferences and profiles, is that even though these funds all have the same general approach, (high-yield and diversification), their composition is quite different. With the exception of Consumer Goods/Staples (which is the second largest sector for each) sector weighting is all over the map. Utilities makes up less than 10% of the Vanguard ETF, but is over 25% for Powershares. iShares has less than 1% Financials, but for SPDR, Financials make up its most significant holdings. 2) Fees Fees are important, that goes without saying. But unlike actively managed funds, with fees that average nearly .9% , ETFs as a whole are considered low-cost alternatives. But even with their general cost effectiveness compared to managed alternatives, it is still worth looking into which fees of index funds to make sure you keep as much of your hard earned money as possible. (click to enlarge) Winner: Vanguard. No surprise here. Vanguard’s low-cost approach to investing is something the company is very proud of. Honorable mention to iShares, which is within striking distance of Vanguard and three and four times cheaper than SPDR and Powershares, respectively. 3) Total return HDV Total Return Price data by YCharts Winner: Powershares. Past performance does not guarantee future results, and these ETFs are designed to primarily track an index. But at the end of the day, over the past five years, PEY has outperformed its competition from 8% to nearly 20%. 4) Liquidity The ability to get out of a great investment is just as important as the ability to get in. While ETFs are generally regarded as having higher liquidity than mutual funds (primarily because they can be traded throughout the day, rather than just at the end), there are reasons to avoid ETFs with excessively low volume. Chief among these are higher bid-ask spreads, which may result in the inability to profitably execute a short-term trade (not a real issue for long-term investors). However, one of the issues that arises from low liquidity (a deviation between price and NAV) can actually be an opportunity. If an ETF is trading slightly below its NAV, but the market is not active enough for it to quickly resume equilibrium, you can shave a few points off your basis by looking for opportune entry points. (click to enlarge) Winner: SPDR. More volume means better pricing (both in relation to NAV and narrow bid/ask spreads). Honorable mention everybody else. All of these ETFs provide adequate liquidity to be considered both investable and tradeable. 5) Price/earnings multiple Winner: Vanguard. It is trading at a discount both to its high dividend ETF peers but also to the S&P 500, NASDAQ and Dow Jones Industrial average . 6) Yield (click to enlarge) Winner: iShares. While all but SPDR best the 30-year Treasury yield, none of these ETFs beat the 6 stock semi-weekly dividend portfolio I wrote about recently. So, which high yield dividend should you own? Vanguard! The low-cost investing house has outdone itself with its Vanguard High Dividend Yield ETF. It has assembled a large, diverse group of stocks that pay above average dividends at rock-bottom fees trading at a reasonable price/earnings multiple. While yield is not the end-all be-all of investing, for those with assets that need income, a high-yield dividend ETF can be a perfect way to get diversified equity exposure without hitching your wagon to just a handful of stocks. A word of caution: Do your homework. Monitor your holdings. Just because one of these funds is right for your portfolio right now, doesn’t mean it will stay that way forever. Depending on rebalancing frequency, a large run up in price of an individually large stock or sector can result in a fund that is incompatible with your goals or risk preferences.

An Interesting Contrarian Utility Selection

E.ON is Germany’s largest electric utility and has announced it is splitting into two separate companies. Low commodity pricing since 2009 has decimated earnings and dividends. Analysts are warming up to the companies after the split, but for dramatically different reasons. If you think our electric utility sector is a mess with the potential of disruptive alternative power and distributed power, Germany is in worse shape. According to government goals, all nuclear power plants are to be shuttered by 2022 and coal plants are being phased out as well. Replacing this generating capacity, the German authorities are mandating an increase of renewable generating capacity to 40% of total generating capacity. In addition, the government has found another source of income for taxes – electric bills. According to the US Energy Information Agency, Germany has the second highest residential electricity rate in Europe, with 50% of the residential bill representing taxes and fees collected by the government. Of the $0.39 per kWh average residential price in Germany for 2013, $0.20 is taxes levied by the government to subsidize renewable power generation. The US, for comparison, has a national average residential electricity price of $0.12/kWh including taxes. E.ON SE ADR ( OTCQX:EONGY ) is the largest electric utility in Germany and could be considered a contrary selection facing insurmountable headwinds from several directions. However, management is splitting the company into two separate firms, much like a “good” utility and a “not-so-good” utility. The “good” utility will own the company’s renewable and natural gas power generation assets, its transmission business and its retail electricity and gas business including technology such as smart meters, also known as “customer solutions”. The “not-so-good” utility will own the nuclear, coal and hydro power plants, LNG terminals, oil and gas production, and energy trading. The former will carry the E.ON brand and the latter will be renamed. The split is anticipated in mid-2016 with a majority of the spin-off being distributed to shareholders. E.ON will carry all the debt (expected to be about €18 billion after reduction from recent asset sales proceeds). The new company will initially carry no debt, but a huge contingent liability of about €14 billion for closing the remaining nuclear and coal power plants. Turkish assets will go with E.ON while Russian and Brazilian assets will be transferred to the new company. Ms. Venkateswaran, an analyst at Royal Bank of Canada, estimates of the €9.3 billion in pretax profits in 2013, nearly €5 billion, or 53%, is from the greener, more predictable business that will retain the E.ON brand and €4.4 billion, or 47%, is from business units under the new company. E.ON said it expects to post a net loss in 2014 on expected impairment charges of €4.5 billion in the fourth quarter because of its operations in southern Europe and its conventional generation assets. Underlying 2014 profits before one-time charges are expected to be between €1.5 billion and €1.9 billion. A graphic depiction of the split is offered in their presentation outlining the proposal, with a general profile of each entity. (click to enlarge) (click to enlarge) A detailed explanation is offered on E.ON website through the investor’s presentation linked above. Investors should review this presentation prior to investing as it lays out the future path for E.ON. Much like Exelon (NYSE: EXC ), E.ON’s massive power generation capacity is sold utilizing shorter-term power agreements, with the longest usually 4 years, and puts E.ON at the mercy of commodity power pricing. In the US, long-term power purchase agreements are used, except in the Northeast, Mid-Atlantic, and eastern Midwest. Below is a graph of power prices in Germany going back to 2002. As shown, Day-Ahead Base Load pricing has fallen from €70 in 2008 to €31 currently. (click to enlarge) Source: ISE Fraunhofer pdf Power prices are directly impacted by the low fuel costs of wind and solar, and renewables take a top priority in delivery. Renewables usually comprise an average of 27% of total demand and ranges daily between 10% and 50%. On May 11, 2014, there was a record reached – of sorts. At mid-day, Germany generated the highest percentage of total demand using renewable power at 73% of its electrical needs. It is important to realize that a few days earlier, renewables generated only 12% of customer demand. A description of this event is offered by energytransition.de: Wind power peaked at around 21.3 GW at 1 PM on Sunday, with solar simultaneously coming in at 15.2 GW. Add in the roughly 3.1 GW of hydropower and 3.7 GW of electricity from biomass that Germany usually has, and the output of conventional power plants was pushed down to 26 GW at 1 PM on Sunday. Power demand, however, was only at 59.2 GW, meaning that only 15.9 GW of conventional power was needed to serve domestic demand. The remaining more than 10 GW was for export – a clear indication of how foreign demand for German power is rescuing the conventional sector. However, the article goes on to report wholesale power prices turned negative and power companies were paying customers €65 MWh to consume electricity. It is difficult to make a profit when a company is paying customers to take its product. More information on how the power markets operate in Germany can be found here . Negative power pricing is not just an issue in Germany. In 2013, an Exelon official commented that its two northern Illinois nuclear power plants operate 8% to 15% of off-peak hours with a negative pricing model. German power prices are low, and could go lower. E.ON management has hedged its production for this year and next in anticipation of low prices. 12-month forward pricing is at 10-yr lows of €31, and Germany has 18 gigawatts of unprofitable power plants, according to Sanford C Bernstein Ltd. According to Bloomberg, the 12-month benchmark could drop 4.6 % this month to below 30 euros, a level not seen since late 2003, according to trading companies from Mainova AG in Frankfurt to CF Partners U.K. LLP in London. Last year, power prices in Europe’s biggest economy dropped for a fourth consecutive year, sliding 10 percent in 2014. Low wholesale prices are hurting the utility’s bottom line and E.ON needed an action plan to counter the dramatic turn in profits. As Germany turns to higher and higher amounts of renewables, replacing core base-load with intermittent-load, fast-starting power generation will be at a premium. Nuclear and coal require too much time to ramp up production after being idled, leaving mainly natural gas as the preferred fuel source. Splitting the company is management’s answer to the problem. Earnings and dividends have been falling the past few years. Operating EPS in 2013 were €1.12, is expected to be €0.66 in 2014, and is estimated to rebound this year to €0.92, but fall in 2016 to €0.85. However, the company is expecting to write-down assets in the fourth qtr. 2014 by €4.6 billion and will report a net loss for the year. Just a few years ago, the dividend was €1.33, but management has announced a dividend distribution for this year and next of €0.50. The corporate split is receiving mixed reviews in the media. Morningstar, which has a 5 Star rating on E.ON, recaps the differing of opinions in its unique analysis: Bulls Say: Creative share swaps, divestitures, and cuts in its investment program in response to the European recession suggest that management is intently focused on value-creating growth. Before E.ON’s 33% dividend cut in 2011, dividends had increased an average of nearly 13% per year since 2004. Management is taking steps such as selling non-core assets, cutting back investment, and targeting operating cost cuts to preserve the current dividend. Bears Say: We estimate the German nuclear plant shutdowns will result in about EUR 2.1 billion of lost after-tax profits by 2022. European Union regulators and nationalist interests have limited E.ON’s worldwide growth opportunities and distorted wholesale power markets. Any investments that do not meet the company’s double-digit return on capital hurdle rate will destroy shareholder value. Forbes published an article examining the split. Their take on the move is: It is a compelling plan for many reasons. The first, of course, is that E.ON had to do something. Declining wholesale power prices in Germany, among other factors, has eviscerated the company’s margins. The company will take a $5.6 billion in the fourth quarter and report for the year “substantial negative net income,” which I think is the German phrase for loss. Last year, it reported a net income of $3.1 billion on revenue of $154 billion. The prevalence of solar at peak power times combined with increased efficiency have made large capital projects riskier. But just as important, it’s an interesting deal because it presents a living lab for viewing the future of the energy industry. The “fossil” side of E.ON will now be unencumbered by debates over efficiency. It will be free to sell as much power as it can across Europe. If traditional energy advocates are correct, these assets will grow in value over time. Renewables will prove to be too intermittent, efficiency measures won’t work as promised and the dwindling base of centralized power plants will make these assets even more valuable. Etc. etc. On other hand, If renewable advocates are correct, you will see the Triumvirate of S-software, storage and solar-continue to get cheaper and more reliable. People will use less and not notice the inconvenience. Meanwhile, E.ON will enjoy a better return on investment on these modular assets. Management provided an update just after the announcement to split. From an article on 4-Tradrs.com: UBS analyst Patrick Hummel said he believed that a EUR7 billion cash transfer into the unit with the nuclear plants would be needed to back up nuclear liabilities and ensure an investment-grade rating. Markus Wessel, an energy lawyer in private practice, said the concerns that the costs of decommissioning nuclear power plants will be dumped on taxpayers are unfounded. “Only if there’s an insolvency would there be a risk that the costs would fall on the taxpayers, though an insolvency is very improbable,” Mr. Wessel said. Companies are obliged by the law to prove that they have the necessary financial security to pay for the costs of dismantling and decommissioning to receive a license to operate the nuclear power plant. Mr. Wessel said that because the permission is tied to the company itself, E.ON’s new company would have to go through this same process to have the permits transferred. “If they want to be smart about it, the government will make both of E.ON’s companies liable for the costs before they allow the transfer of permits,” Mr. Wessel added. Mr. Teyssen, CEO of E.ON, said that both companies will be “highly attractive for investors” after the split. For the new entity, “we see strategic potential because small companies will withdraw” from the fossil and nuclear power market and “there will be a world in which one can consolidate and reach market leadership,” he added. As well as the power plants in Germany, the new company would also own large water power assets, natural gas plants, lignite plants, pipelines, the largest system of natural gas storage facilities in Europe and one of the Continent’s largest trading houses, the chief executive said. A big concern is the unprecedented nature of tasks that lie ahead for E.ON. “There are a lot of uncertainties as to the cost of the liabilities,” said Equinet analyst Michael Schaefer. “We also don’t have much experience when it comes to shutting down nuclear reactors over a span of a decade and the costs include all phases of dismantling and decommissioning, including cooling and storage.” “The real question is whether the new company will have sufficient assets in the long-term to generate cash flows that would cover future obligations,” Mr. Schaefer said. “If wholesale prices for conventional energy remain low, will be hard to cover cash outflows.” Reuters offers an interest perspective in its opinion that the split makes the new E.ON more attractive as an acquisition target. Institutional investors are seeking investments that balances government regulated utilities and high dividend payout potential. Following the spin-off in 2016, nearly two thirds of E.ON’s profits will come from distribution assets – grids whose returns are set by regulators and usually move within the mid to high single-digit percentage range. Roughly a quarter will come from end-customer services and the rest from solar and wind power, the fastest-growing sector within the energy industry. “The bottom line is that pension funds could certainly live with this kind of earnings profile,” said Torsten Graf, fund manager at Frankfurt-based MainFirst and a holder of 61,000 E.ON shares. Macquarie estimates that under the new set-up E.ON will have an equity value of 19.6 billion euros and net debt of about 18.6 billion, with an enterprise value to forecast core earnings (EV/EBITDA) ratio of 8.4, a premium to E.ON’s current 7.8 as well as to the 6.9 of its biggest European peers. The company will own 4.4 gigawatts (GW) of renewable capacity, equal to about four nuclear plants, control more than 1 million kilometres in distribution grids in Europe and have 33 million customers. Core earnings of the future E.ON group are expected to grow by nearly a fifth to 5.5 billion euros by 2020, according to Deutsche Bank estimates. In contrast, the unit to be spun off is seen trading at a much lower 5.6 times EV/EBITDA, mainly due to concerns over the quality of its assets, most notably 51 GW of conventional generation capacity, that have earned it the label of a “bad utility”. Bankers estimate that even though the unit to be spun off will be initially debt-free, it will have a much harder time attracting investors, mainly due to the 14.5 billion euros in provisions it will have to shoulder for nuclear decommissioning. According to 4-traders.com , timeliness consensus from analysts is improving. Of the 31 analysts that follow E.ON, consensus recommendations are: Buy or Outperform 32%; Hold 42%; Underperform or Sell 26%. The graphic below outlines these recommendations. The consensus price goal is €15.20 with a range of €12 to €19, vs. a current price of €13.60. At the high target, capital appreciation could be up 49%; at the consensus, appreciation could be up 15%; and the low target would represent share prices down 9.4%. The second graphic compares share prices and consensus price target going back two years. As shown, the share price decline over the past year coupled with the rise in price targets offers the best potential opportunity in the past two years. Stock price is in black, consensus target is in green Source: 4-traders.com Fastgraph depicts the pain suffered by E.ON shareholders since its peak in share price in 2008. Share prices for EONGY has dropped from $75.65 to a current $15.36. Source; fastgraph.com Return on invested capital ROIC is in line with US-based industry peers. Over the previous 5-years, E.ON has generated an average 4.9% ROIC. Below is a 15-yr graph of ROIC, courtesy of fastgraphs.com. (click to enlarge) Source: fastgraph.com The headwinds for E.ON are many, with some stronger than others. In order for E.ON to do well over the next few years, the following events most likely need to transpire: 1) The dollar declines against the euro. The higher the USD goes, the lower the share price and dividend are when converted back to USD. 2) The euro has to survive the current financial crisis of low growth and pre-recession data. The Greek elections empower those that are anti-austerity and endorse more government spending. 3) Electricity prices need to improve in Germany, probably in tandem with a reduction of additional base-load capacity and a premium paid for reliability. 4) The issues of higher distributed generation and a heavy intermittent generation profile are reconciled with the base load needs of customers. 5) Demand for electricity picks up. Investors need to appreciate the impact of a falling euro/rising USD. At the current €1.12 = $1 USD, the annual €0.50 dividend is worth $0.56, and share prices are $15.32. If the euro were to drop to parity, as predicted by some, the dividend would be worth $0.50 and share prices would be $13.62, based on today’s close in Europe. With the current uncertainty, taking a small position would be advisable as there could be better opportunities over the next 12 months. Author’s Note: Please review full disclosure on Author’s profile. Editor’s Note: This article discusses one or more securities that do not trade on a major exchange. Please be aware of the risks associated with these stocks.

Relative Value The Reason To Keep Buying Munis And Long Bond ETFs

Two-and-a-half years back, the U.S. Federal Reserve, placed that percentage at 2%. Yet the U.S. has failed to hit the bulls-eye. In spite of the media hype that surrounds the notion of imminent Fed rate hikes, history suggests that the Fed will need to remain exceedingly “patient.” As much as the Fed might like to get us all off the drug of ultra-low borrowing costs, there are other risks with raising rates too soon. Since the Reserve Bank of New Zealand first formerly targeted inflation rates roughly 25 years ago, other central banks around the globe have followed suit; that is, many banks have been setting medium-term rates that prices should rise on an annualized basis, and then presenting those percentages publicly. Two-and-a-half years back, the U.S. Federal Reserve, placed that percentage at 2%. Yet the U.S. has failed to hit the bulls-eye. Trillions in electronically created dollars over 30 some-odd months, coupled with zero percent overnight lending rates during the Fed’s inflation targeting period, and the U.S. is still a long way from the stated goal. In spite of the media hype that surrounds the notion of imminent Fed rate hikes, history suggests that the Fed will need to remain exceedingly “patient.” In the quarter century of inflation targeting (at least as far as I have been able to determine), the Fed has never kicked off a rate tightening period when inflation sat below 2%. In truth, the Fed is not oblivious to the fact that dogged determination to move towards the normalization of overnight lending rates is more likely to hinder economic progress than ensure price stability or advance employment objectives. Who but a few members of Congress will grumble at Janet Yellen’s Fed deciding to push back into Q3 or Q4? After all, haven’t we already lived with zero percent rate policy (ZIRP) for six-plus years? As much as the Fed might like to get us all off the drug of ultra-low borrowing costs, there are other risks with raising rates too soon. With both Japan and Europe injecting trillions of QE dollars in an effort to boost inflation and improve economic prospects abroad, the money inevitably finds its way into market-based securities of relative value. The German 10-year? 0.35%. Spain? 1.3%. What overseas institution or money manager would not look at those 10-year yields and consider the safety of U.S. 10-year treasury bonds at 1.8% instead? Or our ultimate safe haven prospect, the 30-year at 2.37%. Granted, those are obscenely low yields that barely compensate for historical cost of living. On the other side of the ledger, though, the U.S. bond market has plenty of room to run on price before comparable yields match those of overseas sovereign debt securities. Yet these facts epitomize the Fed’s dilemma. The 30-Year (TYX):10-Year (TNX) spread has moved from 0.90 one year earlier to 0.57 today; the spread between the 10-Year and the 2-Year has shifted from 2.43 to 1.28. The yield curve continues to compress, and may get close to partial inversion if the Fed fails to exercise patience. Inverted yield curve? Partial inversion? What’s the big deal? Well, you’re talking about a circumstance where the odds of a domestic recession increase dramatically. Inverted yield curves have a near-perfect record of forecasting recessions in the U.S. For that matter, raising local rates before determining whether Europe, Japan and the rest of the world are capable of escaping respective recessions and stagnation is akin to suggesting the U.S. is self-sustaining island. Decoupling theories notwithstanding, the well-being of the United States is still very much dependent on what happens on the world stage -from China to Russia to Germany to Saudi Arabia. The investing implications may be as simple as supply and demand. Wouldn’t intermediate and long-term rates naturally go higher if demand for government bonds were waning? Similarly, with prominent proxies like the German 2-year heading further and further into negative returns, why on earth would foreign institutions and/or wealthy foreigners stop buying U.S. debt? The Vanguard Long-Term Bond ETF (NYSEARCA: BLV ) is still a winner when it comes to the probability of price gains. Meanwhile, if you’re looking to ensure higher monthly distributions, munis still offer relative value. The SPDR Nuveen Barclays Municipal Bond ETF (NYSEARCA: TFI ) works, and for those who welcome a little leverage and are not afraid of some volatility in the space, consider closed-end muni bond funds like the Nuveen Municipal Opportunity Fund (NYSE: NIO ) or the Eaton Vance National Municipal Opportunities Trust (NYSE: EOT ). As much as U.S. investors would like to believe in the miraculous, never-say-die, resilience of the U.S. economy, the facts about our “low” unemployment rate and our “accelerating” gross domestic product (GDP) are entirely misleading. Only 46% of 16-54 year olds are working; it was closer to 52% at the eve of the Great Recession in December 2007. Tens of millions of retirees in the early 50s? Not bloody likely. And what about the acceleration of GDP in the last few quarters? It is primarily due to an undesirable increase in household debt. Here is a brief history lesson. Americans held $6.3 trillion in household debt in June of 2002. Due to the housing bubble in which anyone could borrow any amount to get rich quick, that number swelled to $12.6 trillion by June of 2008. The Great Recession required that consumers had to deleverage, refinance or default, but total household debt only dropped to $11.3 trillion by December 2012. Perhaps ironically, the reamarkble stock gains that occurred in 2013 and 2014 are partially attributable to household debt climbing back up once more, up to $11.7 trillion at the latest figures of September 2014. Some argue that this proves that U.S. consumers have been happily consuming. Well, yes… on borrowed dollars. After all, real wages have been declining and are actually lower than they were in December of 2007. Isn’t it true that the lower interest rates make the cost of servicing $11.7 trillion in September 2014 much more sustainable than the cost to service debt back in June 2008? Absolutely. Unfortunately, this notion of debt servicing costs being the only important factor means interest rates need to stay permanently lower for U.S. consumers to borrow-n-spend. If rates go higher, the only way that picture does not get ugly is if Americans start earning a whole lot more from their employers. In other words, either rates have to stay exceptionally low for households and the U.S. government to service the monstrous debts, or households and the U.S. government need to earn a whole lot more than they’ve been earning. Which scenario do you see as most probable – employers paying workers higher real wages in the months and years ahead, or the Federal Reserve barely touching the overnight lending rate? In 15 years, the Bank of Japan (BOJ) has not been able to get their overnight lending rate above 0.5%. When you combine the reality of low rate addiction/necessity with limited supply/extraordinary demand for longer-term sovereign debt, you conclude that yields will keep falling. Investment possibilities should include: BLV, TFI, NIO, EOT, as well as the Market Vectors Long Municipal Index ETF (NYSEARCA: MLN ) and the SPDR Nuveen S&P High Yield Municipal Bond ETF (NYSEARCA: HYMB ). Disclosure: Gary Gordon, MS, CFP is the president of Pacific Park Financial, Inc., a Registered Investment Adviser with the SEC. Gary Gordon, Pacific Park Financial, Inc, and/or its clients may hold positions in the ETFs, mutual funds, and/or any investment asset mentioned above. The commentary does not constitute individualized investment advice. The opinions offered herein are not personalized recommendations to buy, sell or hold securities. At times, issuers of exchange-traded products compensate Pacific Park Financial, Inc. or its subsidiaries for advertising at the ETF Expert web site. ETF Expert content is created independently of any advertising relationships.