Tag Archives: transactionname

How To Tap Into Developed Market Dividend Growth

Summary Developed markets offer attractive dividend growth opportunities. A highlight of the ProShares MSCI EAFE Dividend Growers ETF. Breakdown of developed countries and their dividend prospects. By Todd Shriber & Tom Lydon The U.S. remains the benchmark destination for dividend growth, but some other developed markets are credible payout growth destinations. That theme can be accessed with several exchange traded funds, including the ProShares MSCI EAFE Dividend Growers ETF (NYSEArca: EFAD ) . EFAD, which debuted in August, tracks MSCI EAFE Dividend Masters Index, which holds members of the MSCI EAFE Index that have increased their dividends for at least 10 straight years. The emphasis on dividend increase streaks is the backbone of some of the most popular U.S.-focused dividend ETFs. At the country level, EFAD is top heavy as over 48% of its geographic weight is allocated to the U.K. However, that is not a problem for an international dividend growth ETF because the U.K. is one of the best, if not the best, ex-U.S. dividend growth markets. In 2014, U.K. firms once again offered excellent dividend growth. Payouts there surged 31% to $135 billion, according to Henderson Global Investors. Despite the overweight U.K. position, EFAD’s other country holdings offer ample room for dividend growth as highlighted by the ETF’s 1.2% 30-day SEC yield. Japan, EFAD’s third-largest country allocation at nearly 8%, is finally starting to climb the dividend ladder. For the year ended March 31, total dividends paid in Japan are expected to have risen 13% to $79.5 billion. It is estimated that total payouts in Japan this year will be more than triple the number seen in 2013. The average dividend yield for Tokyo Stock Exchange first-section companies, which include almost all of Japan’s top names, is 1.36%, according to the Wall Street Journal . Switzerland, EFAD ‘s second-largest country weight at 9.8%%, is one of the steadiest Europe ex-U.K. Dividend growth markets. Estimates indicate that in 2014, the 20 largest firms listed on Switzerland’s benchmark Swiss Market Index paid a record $37.2 billion in dividends. Australia, EFAD’s fourth-largest country weight at almost 5.6%, is another high-yielding developed dividend growth market. “According to figures from Bloomberg and Lincoln Indicators, that has seen dividend payouts by Australia’s top 200 companies jump by 64 per cent in 5 years – from $38 billion in 2010 to $62 billion to date this financial year,” according to Australia’s ABC News . Australia is one of the countries where the dividend yield on the benchmark equity index is higher than the yield on government bonds. Investors are starting to embrace EFAD’s story as the ETF has more than doubled in size during the second quarter. ProShares MSCI EAFE Dividend Growers ETF (click to enlarge) Disclosure: I/we have no positions in any stocks mentioned, and no plans to initiate any positions within the next 72 hours. (More…) I wrote this article myself, and it expresses my own opinions. I am not receiving compensation for it. I have no business relationship with any company whose stock is mentioned in this article.

5 Ways Kids Can Pay For Father’s Day

Summary Father’s Day is on June 21; here are 5 ways for kids to afford a present. Some are small (starting at $10) and some are large (> $100,000). 3 examples of high yield equity opportunities for the family bank. Father’s Day has a -EV Father’s Day is unavoidably coming up later this month. The utility leakage from gift giving is usually measured at around 50%. Thus holidays such as Father’s Day are the inverse of value investing: turning $1.00 of cash into about $0.50 of value has a terribly negative expected value/-EV. With a houseful of young kids, my pain is especially acute. I am, one way or the other, coughing up the $1.00. As far as the likely gifts, the most common ones are “paper weight” defined herein as anything with mass enough to hold down paper, typically covered in glitter. Glitter Paperweights Do I want a glitter paperweight? One piece of solid evidence would be if I had ever attempted to purchase one on my own. I have not. However, for the sake of research, I found that I could have easily bought one for myself on Amazon (NASDAQ: AMZN ). The fact that I have not and have not ever seriously considering doing so has failed to discourage my kids’ production and gifting of glittery paperweights. Saving and Investing Ideas for Kids So, if I am going to try and improve future Father’s Days, how can I encourage adequate funding and taste? This project benefits from the phenomenon that it is easy to improve in percentage when one starts from an extremely low base on both metrics. 1.) $10/year/kid from Toronto-Dominion Bank (NYSE: TD ) TD offers a summer reading program in which kids can earn $10 each for reading 10 books. You can get the form here . In addition, our TD branch has a coin deposit machine. As it accepts only US$, the rejects slot typically contains a few dollars’ worth of Canadian and other foreign coins for the kids to collect. 2.) $40/year/kid from Airbanking Kids can each earn $40/year in interest in a junior airsavings account . These accounts offer an annual percentage yield/ABY of 4% for accounts up to $1,000 owned by depositors under eighteen years old. 3.) $50/year/kid from DFCU Financial Deposits age 0-17 get $50 in cash per $100 account. If you have an account at DFCU or if you can open one (either via a family relationship or living in their region of Michigan), it might be worth getting your kids set up with accounts too. 4.) $272/year/kid from Fidelity The best credit card deal available is the Fidelity Investment Rewards American Express (NYSE: AXP ) Card. There is no age limit. You can co-sign the agreement, get cards in your kids’ names and start building their credit history. The average American kid’s expenses are $13,611 per year. With the 2% cash back on this card, that comes to a rebate of $272 each year. Once the kids are legitimately earning income from chores, they can start funding their IRAs. 5.) $109,565/year/kid from family bank According to the IRS, the long-term adjusted Applicable Federal Rate/ AFR is currently 2.3%. In order to qualify as a loan, parents need to charge that amount of interest to each kid. However, parents can also gift the interest rate payment up to $28k . So, one can loan up to $1,217,391 from each couple to each of their kids per year without it costing them any net interest. If they can compound at 9% per year, that will come to just under $110k per year per kid. 9% Average Yield Investments Where can you find ideas that compound at an average of 9%? Here are three examples of high yielding equity opportunities that average at a 9% annual yield: 6% Yield From Intel’s Deal With Altera INTC reached a deal with ALTR. This deal was due to a concerted shareholder effort. INTC wanted the deal and ALTR holders did, too. After this effort from the owners, there is still an opportunity. 11% Yield: Integrys, A Safe UTE With A Catalyst Integrys is a safe utility investment. It is currently being bought by WEC. TEG holders get > 11% annualized between now and closing. 10% Yield From IGATE IGATE is getting bought by Capgemini. You can capture a 10% yield. IGTE shares trade about $0.50 beneath the deal price. It will probably close in a month. Maintain control over cash flow After year one, parents can toggle on our off the gift of the interest rate payments as per their choice. Without the gift, the interest payments come to $84,000 per year for a family with three kids, which is in excess of the $75,000 annual income that Nobel laureate Danny Kahneman’s study indicates is the maximum annual income at which money is positively correlated to happiness. Do You Trust Your Wife? This is an important question in terms of maximizing expected value across a family. If you have no one whom you can trust, then the idea of investing in order to achieve some specific payoff structure makes sense. Instead, if you want to maximize expected value across a family, you can use the family bank to move the more equity-like investments down generationally and the more credit-like investments up generationally. This liberates investors from reliance on high nominal yield. In the case of dividends, they are increasingly expensive. I have long advocated certain dividend investments such as the WisdomTree Total Dividend ETF (NYSEARCA: DTD ). Since writing up DTD on Seeking Alpha as a long idea, it has returned over 75%. However, that leaves its prospective dividend rate at a relatively paltry 2.12%. With the family bank you will get a higher 2.3% yield while your children are able to benefit from higher returning equity opportunities. Long-term Goal While I want to have everything organized as efficiently and rationally as possible, my long-term goal is to create independent adults. I have a reminder on my Microsoft (NASDAQ: MSFT ) Outlook calendar to have the locksmith come to change the locks when the youngest kid turns eighteen. After that, I expect them to succeed under their own power. I hope that they will be independent of me. At the same time, I have no plans to be independent of them. I plan to borrow any and all toys that they acquire and I do not intend to reimburse them for the fuel. Finally, if they are reading this, it is time for me to come out with the truth: I do not need any more paper weights and I do not like glitter. Those are my thoughts on financing. As far as tastes, I don’t really have great taste. Fortunately, I know someone who does. So, if they want, they can read more about that on my Father’s Day Wish List . Disclosure: I am/we are long DTD. (More…) I wrote this article myself, and it expresses my own opinions. I am not receiving compensation for it. I have no business relationship with any company whose stock is mentioned in this article. Additional disclosure: Chris DeMuth Jr is a portfolio manager at Rangeley Capital. Rangeley invests with a margin of safety by buying securities at deep discounts to their intrinsic value and unlocking that value through corporate events. In order to maximize total returns for our investors, we reserve the right to make investment decisions regarding any security without further notification except where such notification is required by law.
X-Raying CEFL (Part 2): Geographical Distribution

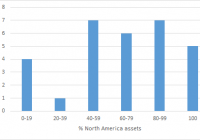
Summary A previous article in this series investigated the leverage and expense ratio statistics of CEFL, a 2X leveraged CEF fund-of-funds. This article presents the geographical breakdown of CEFL. How much international exposure does CEFL contain? Introduction The ETRACS Monthly Pay 2xLeveraged Closed-End Fund ETN (NYSEARCA: CEFL ) is a 2x leveraged ETN offered by UBS. CEFL tracks twice the monthly return of the ISE High Income Index [YLDA], an index that is comprised of high-yielding close-ended funds [CEFs]. The methodology used to construct YLDA has been summarized here . The YieldShares High Income ETF (NYSEARCA: YYY ) tracks the same index as CEFL. While many investors are attracted solely by CEFL’s high yield (currently 20.39% ttm), I believe that it is also important to look “under the hood” of the fund and to understand its characteristics. In a previous article , we delved into the holdings of CEFL to derive relevant leverage and expense ratio statistics regarding this fund. From that analysis, we found that CEFL is approximately comprised of one-third equity and two-thirds debt, CEFL is effectively leveraged by 240%, and CEFL exhibits a total expense ratio of 4.92% per dollar invested in the fund (or 2.05% per dollar of assets controlled), after accounting for acquired fund expenses. This article seeks to present the geographical distribution of CEFL in terms of its overall holdings, or in terms of equity and debt components. Methodology The geographical distribution of the component funds was obtained from CEFConnect , Morningstar or the fund websites. As some CEFs only report their allocation by region rather than by country, it was decided to present the data in terms of region only. The five regions are North America (includes Canada), Europe (includes Russia), Asia Pacific (includes Japan and Australia), Latin American and Middle East/Africa (includes Turkey). There is also a sixth category of “other” due to the fact that some funds do not report beyond their top 10 country holdings. The funds The following table shows the fund name, ticker symbol, % assets, and % of assets in region. Fund Ticker Assets North America Europe Asia Pacific Latin America Middle East/Africa Other GAMCO GLBL GOLD NAT RES (NYSEMKT: GGN ) 4.52% 77.9 11.5 2.1 6.0 2.5 0.0 DOUBLELINE INCOME SOLUTIO (NYSE: DSL ) 4.38% 47.4 13.0 0.0 14.6 0.0 24.9 EATON VANCE TM GL DIV EQ (NYSE: EXG ) 4.28% 55.6 36.2 8.1 0.0 0.0 0.0 FIRST TRUST INTERMEDIATE (NYSE: FPF ) 4.28% 49.2 39.7 0.0 1.2 0.0 9.9 ALPINE TOTAL DYNAMIC DIVD (NYSE: AOD ) 4.27% 53.2 29.0 5.6 0.0 0.0 12.3 EATON VANCE LIMITED DURAT (NYSEMKT: EVV ) 4.26% 90.5 5.4 0.0 0.0 0.0 4.1 MFS CHARTER INCOME TRUST (NYSE: MCR ) 4.24% 67.6 11.8 2.3 0.0 0.0 18.3 CLOUGH GLBL OPPORTUNITIES (NYSEMKT: GLO ) 4.24% 88.9 3.6 12.3 0.0 0.0 -4.7 BLACKROCK CORPORATE HIGH (NYSE: HYT ) 4.20% 100.0 0.0 0.0 0.0 0.0 0.0 ALPINE GLOBAL PREMIER PRO (NYSE: AWP ) 4.19% 31.8 26.9 28.5 3.7 2.2 6.9 WESTERN ASSET EMG MKT DBT (NYSE: ESD ) 4.18% 0.0 25.4 4.5 57.3 0.0 12.8 VOYA GLBL EQTY DIVD FUND (NYSE: IGD ) 4.12% 45.8 39.3 8.7 0.0 0.0 6.2 PRUDENTIAL GL SH DUR HI Y (NYSE: GHY ) 4.11% 69.4 20.0 0.0 2.0 0.0 8.6 PIMCO DYNAMIC CREDIT INCO (NYSE: PCI ) 4.11% 76.1 6.5 12.0 5.5 0.0 0.0 BLACKROCK INTL GROWTH&INC (NYSE: BGY ) 3.91% 11.7 54.5 28.0 1.3 2.1 2.4 MORGAN STANLEY EMERGING M (NYSE: EDD ) 3.88% 0.0 33.3 23.3 43.2 26.6 0.0 EATON VANCE TAX-MGD DV EQ (NYSE: ETY ) 3.81% 92.9 6.6 0.0 0.0 0.5 0.0 ABERDEEN ASIA-PAC INCOME (NYSEMKT: FAX ) 3.43% 2.7 3.2 94.1 0.0 0.0 0.0 PRUDENTIAL SHORT DURATION (NYSE: ISD ) 3.15% 100.0 0.0 0.0 0.0 0.0 0.0 CALAMOS GLOBAL DYNAMIC IN (NASDAQ: CHW ) 3.11% 57.8 24.0 11.5 1.0 1.3 4.4 MFS MULTIMARKET INC TRUST (NYSE: MMT ) 2.84% 100.0 0.0 0.0 0.0 0.0 0.0 BLACKSTONE/GSO STRATEGIC (NYSE: BGB ) 2.65% 100.0 0.0 0.0 0.0 0.0 0.0 ALLIANZGI CONVERTIBLE & I (NYSE: NCV ) 2.42% 100.0 0.0 0.0 0.0 0.0 0.0 WESTERN ASSET HIGH INC FD (NYSE: HIX ) 2.19% 98.2 0.0 0.0 0.0 0.0 1.8 BLACKROCK MULTI-SECTR INC (NYSE: BIT ) 1.89% 84.7 12.6 1.2 0.0 0.0 1.6 WELLS FARGO ADV MULTISECT (NYSEMKT: ERC ) 1.56% 78.8 4.6 2.2 4.5 2.3 7.6 ALLIANZGI CONV & INCOME I (NYSE: NCZ ) 1.35% 84.2 15.8 0.0 0.0 0.0 0.0 WELLS FARGO ADVANTAGE INC (NYSEMKT: EAD ) 1.33% 94.9 4.4 0.1 0.0 0.0 0.6 NUVEEN PFD INC OPP FD (NYSE: JPC ) 1.12% 57.6 35.4 0.0 0.0 0.0 7.0 INVESCO DYNAMIC CREDIT OP (NYSE: VTA ) 0.96% 70.1 19.8 0.0 0.0 0.0 10.1( The following chart shows the frequency distribution of CEFs at different percentages of North American assets, the vast majority of which are U.S. assets. Geographical distribution The respective regions shown in the table above were, after accounting for the leverage of each fund, summed to determine the overall geographical distribution of CEFL. The results are presented in the graph below. We can see from the chart above that North America accounts for just over two-thirds (68.2%) of the assets of CEFL. The second-largest region is Europe, at 14.8%, followed by Asia Pacific, at 8.3%. Latin American and Middle East/Africa represent relatively minor regions at 3.9% and 0.4%, respectively. Finally, 4.4% of the assets were unaccounted for in this analysis. The next chart shows the geographical breakdown for the equity and debt components of CEFL. Recall that CEFL is comprised of approximately one-third equity and two-thirds debt. Note that for hybrid funds, I have made the assumption that the region distribution is the same for the equity and debt components of the fund. We can see from the chart above that the debt portion of CEFL contains more North American exposure (71.6%) compared to the equity portion (57.1%). On the other hand, the equity portion of CEFL contains more European exposure (25.9%) compared to the debt portion (11.4%). Discussion and conclusion This article sought to evaluate the geographical exposure of CEFL. The main conclusion from this analysis was that CEFL contained around two-thirds of North American (primarily U.S.) assets, meaning that the fund has around one-third of international exposure. What does this mean for investors? Obviously, investors who are uncomfortable with any level of international exposure should avoid CEFL, as around one-third of the fund is in foreign assets. However, other investors may be attracted to the diversification benefits offered by the international exposure of CEFL. For example, a portfolio of 70% U.S. stocks and 30% international stocks (close to the geographic allocation of CEFL) has returned 11.4% a year since 1950, which is about 2% more than S&P500, but with about 10% less risk. Additionally, I like that the North American component of CEFL contains a higher allocation to debt vs. equity than the European component of CEFL. European debt is currently low-yielding and hence expensive, with struggling countries like Spain (2.26%) and Italy (2.28%) having the same 10-year bond yields as the U.S. (2.26%), and even lower yields for Germany (0.75%) and France (1.16%). On the other hand, European stocks are a lot cheaper than U.S. stocks, with CAPE ratios of 8.6 and 16.5 for emerging and developed Europe, respectively, compared to 26.0 for the U.S. Therefore, value investors like myself would be especially pleased with CEFL’s higher allocation towards European equities compared to European debt. I hope this information will be useful for investors in or considering investing in the fund. Disclosure: I am/we are long CEFL. (More…) I wrote this article myself, and it expresses my own opinions. I am not receiving compensation for it (other than from Seeking Alpha). I have no business relationship with any company whose stock is mentioned in this article.