Tag Archives: transactionname

The Fed Provided A Short-Term Boost To SLV

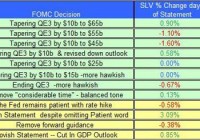
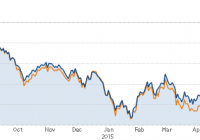
Summary The FOMC meeting concluded with a dovish statement and press conference. The silver market benefits from a dovish Federal Reserve. A potential rate hike could have a modest, negative impact on the price of SLV. The FOMC, as expected, didn’t raise rates and presented a dovish statement without dissenters. This news provided some backwind to the iShares Silver Trust ETF (NYSEARCA: SLV ) that came up in the last few days, albeit it’s still down by 8.5% over the past month. Let’s examine the recent FOMC meeting and its possible implications on SLV. Following the recent FOMC statement and press conference, the market revised down its outlook of the Fed’s rate “lift off”: The implied probabilities dropped to a 17% chance of a rate hike in September and 57% in December. In January 2016, the odds are 72% – nearly the same odds for a December rate hike only a week ago. The statement, which wasn’t changed much and didn’t offer any major headlines, still led to a modest rally in the price of SLV, as presented below. The dovish tone in the statement and Yellen’s press conference that followed suggested that even after the inaugural “lift off”, the FOMC will keep rates low – conditions that benefit the silver market. (click to enlarge) Source of data taken from FOMC and Google Finance The FOMC revised down its projections for the 2015 U.S. GDP growth rate from 2.5% in March to 1.9%. The rate of unemployment slightly increased to 5.25%. There weren’t any other major changes in the FOMC’s economic projections. Since Yellen reiterated that the first rate hike will still be data dependent, this means that if in the next few months the economic data show a stable recovery, e.g. NFP reports keep showing steady growth in jobs, lower unemployment, faster growth in wages, better GDP figures, higher inflation (just to name a few), the FOMC could decide to raise rates this year. As long as the FOMC keeps rates low, the silver market in general and SLV in particular benefit from it. Also, even if the FOMC were to start raising rates, the cash rate is likely to remain low, as Yellen suggested in the press conference, for a while. After all she tried, yet again, to diverge the attention from the historic first rate raise to the pace of subsequent rate hikes. She emphasized that rates will rise gradually; as such, this means the normalization policy is likely to have a modest adverse impact on SLV. In terms of the dot plots, FOMC members are still incline to raise rates this year, perhaps by September – this will allow for at least two rate hikes of 0.25% and bring the cash rate to 0.5% by the end of the year. For 2015, the median target range of the Federal Reserve hasn’t changed – it’s at 0.625% – albeit fewer FOMC members have picked higher rates and the projections are now more concentrated around lower interest rates, as you can see below: Source: FOMC’s website For 2016 and 2017, members slightly lowered their projections so that the median point declined by 0.25 percentage points for each year. This is another dovish indication that the trajectory of the future rate hikes could be more moderate than previously projected. Source: FOMC’s website In a CNBC interview, Richard Fisher, who is considered a hawk and was former president of the Federal Reserve Bank of Dallas and FOMC voting member, stated the dot plot outlook for the coming years is less relevant since the current members may not be there to make rate decisions in 2016-2017. This may be right, but since Yellen will remain at the Fed, we are still likely to see additional dovish FOMC decisions in the coming years. The market’s reaction to the dovish statement also included a depreciation of the U.S. dollar against leading currencies, which also contributed to the modest rise in shares of SLV. Nonetheless, the U.S. dollar could start to rise again especially against the euro – the ECB’s QE program and the ongoing Greek debt crisis are likely to drag down the currency – and yen. A stronger U.S. dollar could play against the price of SLV. The silver market isn’t out of the woods, but the FOMC provided a short-term boost to SLV. The market doesn’t seem convinced that the Fed will raise rates this year. As such, if and once it will occur, it could result in a modest drop in SLV prices. Until such time, as long as the FOMC produces dovish statements, silver will benefit over the short run. For more see: Will Higher Physical Demand for Silver Drive Up SLV? Disclosure: I/we have no positions in any stocks mentioned, and no plans to initiate any positions within the next 72 hours. (More…) I wrote this article myself, and it expresses my own opinions. I am not receiving compensation for it (other than from Seeking Alpha). I have no business relationship with any company whose stock is mentioned in this article.

Hedging The 10-Year? Consider DTYS

Summary DTYS provides a well correlated hedge for 10-year treasury bonds. DTYS, like most alternative investments, is associated with significant risks and is intended for achieving short term goals. Recommended for investors who believe interest rates will rise dramatically over an intermediate time frame. Basic Information The iPath U.S. Treasury 10-year Bear ETN (NASDAQ: DTYS ) is an exchange traded note (ETN). ETNs are unsecured, unsubordinated debt securities. This type of debt security differs from other types of bonds and notes because ETN returns are based upon the performance of a market index minus applicable fees, no period coupon payments are distributed and no principal protections exist. DTYS is intended to move inversely (-1x) to The Barclays Capital 10Y U.S. Treasury Futures Targeted Exposure index. The Barclay’s index is tied to U.S. treasury yields. DTYS seeks investment results for a single day only, not for longer periods. A “single day” is measured from the time the Fund calculates its net asset value (“NAV”) to the time of the Fund’s next NAV calculation. The return of the Fund for periods longer than a single day will be the result of each day’s returns compounded over the period, which will very likely differ from the inverse (-1x) of the return of The Barclays Capital 10Y U.S. Treasury Futures Targeted Exposure index for that period. For periods longer than a single day, the Fund will lose money when the level of the Index is flat, and it is possible that the Fund will lose money even if the level of the Index falls. Longer holding periods, higher index volatility, and inverse exposure each exacerbate the impact of compounding on an investor’s returns. During periods of higher Index volatility, the volatility of the Index may affect the Fund’s return as much as or more than the return of the Index. Expense Ratio: .75% + Portfolio turnover (currently 0% because cash instrument and derivative transactions are not included). How Could it be used? If you are looking for a 10-year hedge, DTYS could be a very beneficial to your portfolio. It is highly correlated to the market, and it is a useful tool any skilled investor should consider. In this article, I’ll attempt to illuminate the risks of investing in an ETN, but with adequate forethought DTYS is not a bad strategy, especially with the threat of rising interest rates. Principal Investment Strategy All investment strategies are used in combination to achieve similar daily return characteristics as -1x of the index: Derivatives – financial instruments whose value is derived from the value of an underlying asset or assets, such as stocks, bond, funds, interest rates, or indexes. Swap agreements – Contracts entered into primarily with major global financial institutions for a specified period ranging from a day to more than one year. In a standard “swap” transaction, two parties agree to exchange the return (or differentials in rates of return) earned or realized on particular predetermined investments or instruments. The gross return to be exchanged or “swapped” between the parties is calculated with respect to a “notional amount,” e.g., the return on or change in value of a particular dollar amount invested in a “basket” of securities or an ETF representing a particular index. Futures Contracts – Standardized contracts traded on, or subject to the rules of, an exchange that call for the future delivery of a specified quantity and type of asset at a specified time and place or, alternatively, may call for cash settlement. Money Market Instruments U.S. Treasury Bills – that have maturities of one year or less and supported by full faith and credit of the U.S. government. Repurchase Agreements – Contracts in which a seller of securities, usually U.S. government securities or other money market instruments, agrees to buy them back at a specified time and price. Repurchase agreements are primarily used by the Fund as a short-term investment vehicle for cash positions. These are the Principal Risks associated with TBX Risks Associated with the Use of Derivatives Compounding Risk Correlation Risk Fixed Income and Market Risk Counterparty Risk Debt Instrument Risk Interest Rate Risk Intraday Price Performance Risk Inverse Correlation Risk Liquidity Risk Early Close/Late Close/Trading Halt Risk Market Price Variance Risk Valuation Risk Non-Diversification Risk Portfolio Turnover Risk Short Sale Exposure Risk As you can see below, estimated returns are volatile, and the funds actual results may be significantly better or worse than the underlying index. Bolded values, not including the x and y axis percentages, are where the fund performed worse than expected. This is meant to illuminate the possibility of under or over performance. Theoretical Fund Returns Index Performance One Year Volatility Rate One Year Index Inverse (-1x) of the One Year Index 10% 25% 50% 75% 100% -60% 60% 147.50% 134.90 94.70 42.40 (8.00) -50% 50% 98.00 87.90 55.80 14.00 (26.40) -40% 40% 65.00 56.60 29.80 (5.00) (38.70) -30% 30% 41.40 34.20 11.30 (18.60) (47.40) -20% 20% 23.80 17.40 (2.60) (28.80) (54.00) -10% 10% 10.00 4.40 (13.50) (36.70) (59.10) 0% 0% (1.00) (6.10) (22.10) (43.00) (63.20) 10% -10% (10.00) (14.60) (29.20) (48.20) (66.60) 20% -20% (17.50) (21.70) (35.10) (52.50) (69.30) 30% -30% (13.80) (27.70) (10.10) (56.20) (71.70) 40% -40% (29.30) (32.90) (44.40) (59.30) (73.70) 50% -50% (34.00) (37.40) (48.10) (62.00) (75.50) 60% -60% (38.10) (41.30) (51.30) (64.40) (77.00) Correlation to 10-year yields I aligned DTYS with 10-year treasury yields. Essentially, DTYS is perfectly correlated to yields. Since bond prices react inversely to yields, it is easy to see why DTYS would be a good choice for hedging rising interest rates. Their are other alternative investment tools like the ProShares Short 7-10 Year Treasury ETF (NYSEARCA: TBX ) . DTYS, in my opinion. is the best direct tool for hedging rates. When rates spike, however, their are a number of other options to consider . My advice for any investor is to expose yourself only to risk you feel comfortable with. Conservative plays often pan out better than risky ones in the long run. DTYS is certainly a risky investment with potential for mediocre to negative returns. Conclusion If you are trying to hedge your investment on 10-Year Treasury yields, then DTYS is probably an ETN you ought to consider. However, it is important for any smart investor to weigh the risks associated with any ETN before jumping into any investment long or short. Disclosure: I/we have no positions in any stocks mentioned, and no plans to initiate any positions within the next 72 hours. (More…) I wrote this article myself, and it expresses my own opinions. I am not receiving compensation for it (other than from Seeking Alpha). I have no business relationship with any company whose stock is mentioned in this article.

Will South Korean Equities Take Off After A Japanese Rally?

Summary Over the decades, the South Korean economy has become heavily dependent on exports. In recent years, strong won have not facilitated growth of South Korea’s GDP and the profitability of local companies. Korean equities trade at very low multiples that limit the downside risk. The introduction of any monetary stimuli could potentially kick off an equity rally. In that case, DBKO could be a winning security. Unlike Japanese stocks, the South Korean equity market has not performed well in recent years. While the most popular Japanese index, Nikkei 225, has appreciated more than 110% since the start of Abenomics in late 2012, South Korean KOSPI has gained almost nothing during the same period. Even though Japan and South Korea have much in common, they are very different in many aspects as well. For example, both countries are known for exporting high-tech products and high-quality vehicles. The South Korean economy is, however, much more reliant on exports, as demonstrated by the graph below. Data Source: The World Bank Strong won and stagnating profitability The reason behind the recent lackluster South Korean equity market returns lies in weak corporate profitability caused primarily by strengthening won. While earnings of companies listed on the First Section of the Tokyo Stock Exchange rose by 97.9% from 11/30/12 (the beginning of Abenomics) to 4/1/2015, earnings of companies included in the MSCI Korea decreased by 2.6% over the same period. It is not a big surprise that earnings of companies such as Samsung ( OTC:SSNLF ), LG Display (NYSE: LPL ), Hyundai ( OTC:HYMPY ) and Kia Motors ( OTC:KIMTF ) were significantly hindered by strong domestic currency as more than half of their revenue comes from outside of the country. Cheap valuation Based on PE multiples, South Korean equities remain incredibly cheap in global comparison. Over the above-stated period, PE of MSCI Korea has expanded from only 10.0x to 10.3x as price and earnings remained almost unchanged. To gain a better insight, PE of TOPIX has decreased from 15.0x to 14.9x thanks to strong corporate profitability due to weakening yen. Moreover, some sectors of Korea Exchange trade at extremely low multiples. This is specifically the case with autos, semiconductors, banks and IT, which last month traded with PE of 6.13x, 8.84x, 8.16x and 10.54x respectively. Some sectors like autos and banks traded even below their book value, with PBV ratios of 0.90 and 0.56 respectively. Will BOK follow in BOJ’s footsteps and introduce monetary stimulus? Without a doubt, the relative strength of South Korean won has been distinctively magnified by foreign quantitative easing programs. South Korea has suffered a great loss of its product competitiveness on overseas markets in particular against Japan. Because both countries compete in very similar markets, the BOJ’s aggressive quantitative easing program has been fatal to South Korean exports. Despite the BOK cutting interest rates to record low levels, the question remains: What will the central bank do after it runs out of its conventional monetary policy measures? We can only speculate for now, but I don’t believe that South Korea would abandon the global currency war if it realizes how important exports are for its economy. President Park stated recently at the National Assembly: We are standing at a crossroads, facing our last golden opportunity; which road we take will determine whether our economy takes off or stagnates. Now is the time for the National Assembly, the Administration, businesses and the people to come together as one and make dedicated efforts to resuscitate the economy. Graph: JPY/KRW since the start of Abenomics (click to enlarge) Source: Yahoo Finance Conclusion The launch of any quantitative easing from the side of BOK would be a bold turning point not only for South Korean won, but also for profitability of South Korean companies as more than half of their revenue comes from abroad. Therefore, subscribing to commentaries of BOK’s board members and closely monitoring the JPY/KRW currency pair can become a potentially rewarding activity. The largest and most liquid South Korea ETF is the iShares MSCI South Korea Capped ETF (NYSEARCA: EWY ), which seeks to replicate the MSCI Korea index. However, this is not a FX-hedged fund and its capital returns in case of introduction of any monetary stimulus would be diminished by currency losses for investors denominated in U.S. Hence, I would consider buying the other two funds – the Deutsche X-trackers MSCI South Korea Hedged Equity ETF (NYSEARCA: DBKO ) and the WisdomTree Korea Hedged Equity ETF (NASDAQ: DXKW ). They both have the same expense ratio of 0.58% and around the same percentage share of assets within its top ten holdings. The key difference between these two funds is in their holdings. Whereas DXKW consists of shares of only 47 firms, DBKO is diversified across 107 companies with significant exposure to Samsung Electronics, which accounts for a fifth of the fund’s assets. Top 10 Equity Holdings as of 17-Jun-2015 Name & Ticker Weight (%) Samsung Electronics Co Ltd 20.77 Sk Hynix Inc ( OTC:HXSCF ) 4.13 Hyundai Motor Co 3.25 Naver Corp ( OTC:NHNCF ) 2.82 Shinhan Financial Group Ltd (NYSE: SHG ) 2.75 Posco (NYSE: PKX ) 2.33 KB Financial Group Inc (NYSE: KB ) 2.31 Hyundai Mobis Co Ltd 2.25 LG Chem Ltd ( OTC:LGCLF ) ( OTC:LGCEY ) 2.13 Amorepacific Corp ( OTC:AMPCF ) 2.10 Data Source: Deutsche Asset & Wealth Management I believe that significant exposure to Samsung Electronics may pay off, as it is one of the most valuable brands in the world with a proven track record of sales CAGR 20.8% from 1989 to 2013 as well as above average earnings growth potential, currently trading at 9.4x PE. Therefore, I believe that DBKO is the single best security to own for eventual South Korean economy revival. Disclosure: I/we have no positions in any stocks mentioned, but may initiate a long position in DBKO over the next 72 hours. (More…) I wrote this article myself, and it expresses my own opinions. I am not receiving compensation for it (other than from Seeking Alpha). I have no business relationship with any company whose stock is mentioned in this article.