Tag Archives: transactionname

Greece, Puerto Rico Or China? Debt-Fueled Excesses At The Heart Of Them All

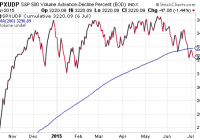
Investors erroneously focus on which human interest story, or combination of issues, is/are of greatest importance. However, the root cause of every high-profile concern is debt-fueled excess. It follows that a responsible media should refrain from concocting unknowable storms and, instead, hone in on the risks associated with ultra-low borrowing costs and/or exceptionally easy credit terms around the world. Lately, I have been fielding a host of “which is worse” questions. Is it the possibility of Greece exiting the euro-zone or is it the potential for Puerto Rico to default on its debt? Is it the 25%-plus bearish retrenchment of China’s Shanghai SSE Composite or is it the likelihood of eventual rate hikes by the U.S. Federal Reserve? In truth, investors erroneously focus on which human interest story, or combination of issues, is/are of greatest importance. However, the root cause of every high-profile concern is debt-fueled excess . It follows that a responsible media should refrain from concocting unknowable storms and, instead, hone in on the risks associated with ultra-low borrowing costs and/or exceptionally easy credit terms around the world. For the purpose of understanding, let’s discuss the debt concerns of Greece, Puerto Rico and China, beginning with the Greek tragedy. Since the origin of the euro-zone, less productive and less economically successful countries had been able to borrow-n-spend at the same favorable rates as the most productive and most successful countries. That’s like giving a $50,000 line of credit to individuals with very different abilities to handle debt – like offering a card to a $200,000 per year earner with a 760 credit score as well as providing a card to a $50,000 per year earner with a 520 credit score. Sooner or later, one of the individuals will not be able to keep up. And in this case, Greece cannot keep up with Germany, Austria or Finland. (Neither can Portugal, Spain or Italy.) Easy borrowing and reckless spending has left Greece with few viable alternatives. Now let’s shift gears to Puerto Rico. Whereas the working-aged population employment rate/labor participation rate in the United States is 62.7%, this number is a mere 40% in Puerto Rico. Over the last decade, corporate tax breaks disappeared for a number of U.S. corporations operating in Puerto Rico, forcing the companies to leave and to take many of those jobs with them. Residents also left over the last decade due to limited job prospects and exorbitant local taxes as high as 33%. Less jobs, less people, high taxation… none of that stopped the Puerto Rican government from borrowing way beyond its means and running enormous deficits. Ironically, U.S. states are not allowed to use debt to increase budget deficits. Puerto Rico did. Eventually, the territory will be bailed out by congressional/While House decree or be permitted to seek some from of bankruptcy protection (after a law or two is passed). Now we come to China. And yes, I will stipulate that the recent turbulence in Chinese stocks as well as China’s underachieving economy as more critical to the performance of risk assets around the globe than Greece or Puerto Rico. This is China – the world’s 2nd largest economy behind only the United States. Of course China matters more than tiny countries or territories. So when loose rules surrounding margin debt helped fuel the miraculous rise in China’s Shanghai SSE Composite, and when the People’s Bank of China (PBOC) recently cut interest rates to ease lenders’ capital settings, and when the Securities Association of China announced that the country’s big brokerages had agreed to put up 120 billion yuan ($26 billion) to prop up Chinese blue-chip equities, one might have hoped for the party to go on. That’s not the case, though. Once again, investors need to take note of why China is struggling at all. Rate cuts mean easier money and excessive margin debt implies debt-fueled excess. As if that weren’t enough, the country’s total government, corporate and household debt load as of mid-2014 is roughly equal to 282 percent of the country’s total annual economic output. China’s debts are growing at a pace that is unsustainable. Debt-fueled excess explained the financial crisis in 2008 for the U.S. Is it any surprise, then, that Greece, Puerto Rico and China have been dealing with similar concerns related to easy credit? (Note: I am not saying that China is a lost cause the way Greece and Puerto Rico are, but simply, noticing the similarity in the genesis of debt-fueled excesses.) What does it all mean for risk assets stateside? Perhaps ironically, there is boundless love for the Federal Reserve in the United States. Nobody seems to believe that the Fed has ever made or will ever make a policy mistake. Yet the Fed erred in its rate policy leading up to the 2000 dot-com collapse; it faltered in keeping rates too low for too long leading up to the 2008 financial crisis, and then failing to recognize the severity of the coming recession in not cutting rates quickly enough. Will Greece, Puerto Rico and even China push the Fed toward keeping zero percent rates in place for all of 2015? Will seven years of zero-percent, ultra-easy rate policy be a good thing, then? And if so, when does it become a bad thing? As I have pointed out in previous columns, sky-high stock valuations and a lusterless domestic economy may not matter in the near-term. Yet they may begin to matter alongside battered faith in the central banks of Europe and/or China; they may begin to matter if waning confidence spreads to the Fed. One of the best ways to determine whether confidence is waning or holding firm is to check in on the market internals (a.k.a. breadth indicators ). Here are three considerations: The Advancing-Declining Volume Line (AD Volume Line) measures the buying and selling pressure behind a market advance or market decline. It goes up when advancing volume is positive; it falls when it is negative. In other words, if there is significant volume behind declining stocks, you have selling pressure and reason for caution. The pressure today is powerful enough for the volume behind decliners to push the AD Volume Line for the S&P 500 below its 200-day moving average for the first time since 2012. We can also look at the Advance/Decline (A/D) Line for the S&P 500. Although there has not been a definitive breakdown in the number of advancers participating in the bull market relative to decliners, the drop-off since mid-May is worthy of continued vigilance. Finally, investors should be mindful of the High-Low Index, This breadth indicator is based on new 52-week highs and new 52-week lows. In essence, when the High-Low Index is above 50, the stock index may be thought to be in an uptrend; when the index is below 50 – when new lows outnumber new highs – the trend may be considered bearish. The S&P 500 Hi-Lo at 56.67 is still positive today, though it sits at its lowest level in 2015. Income assets have been trimmed at the longest-end of the yield curve as well as the middle of the asset risk spectrum. We have concentrated our income in funds like the i Shares 3-7 Year Treasury Bond ETF (NYSEARCA: IEI ) and the BulletShares 2016 High Yield Corporate Bond ETF (NYSEARCA: BSJG ). Most notably, we have raised our cash component of the income picture. Growth assets have been trimmed in the foreign holdings arena. Several had hit stop-limit loss orders , leaving the combined cash from growth-n-income trimmings at roughly 15%-20%. Growth at 50%-55% of most portfolios is primarily comprised of funds that we have held onto for years, including funds like the Health Care Select Sect SPDR ETF (NYSEARCA: XLV ) , the iShares MSCI USA Minimum Volatility ETF (NYSEARCA: USMV ) and the Vanguard Mid-Cap Value ETF (NYSEARCA: VOE ). Disclosure: Gary Gordon, MS, CFP is the president of Pacific Park Financial, Inc., a Registered Investment Adviser with the SEC. Gary Gordon, Pacific Park Financial, Inc, and/or its clients may hold positions in the ETFs, mutual funds, and/or any investment asset mentioned above. The commentary does not constitute individualized investment advice. The opinions offered herein are not personalized recommendations to buy, sell or hold securities. At times, issuers of exchange-traded products compensate Pacific Park Financial, Inc. or its subsidiaries for advertising at the ETF Expert web site. ETF Expert content is created independently of any advertising relationships.

PAK: Your Ticket To The Hidden Gem In Emerging Or Frontier Markets

Investors look for exposure to the frontier markets to diversify their portfolios, but have shied from investing in Pakistan. Although Pakistan attracts a lot of negative news, its economy is improving while the local stock market remains one of the top performing in the world. Pakistani stocks can be a great diversification tool for U.S. investors as they offer zero correlation with the S&P-500. The recently launched Global X MSCI Pakistan ETF gives U.S. investors exposure to this market. Investors look for exposure to the frontier markets to diversify their portfolios, given some of these markets have demonstrated little to no correlation with the S&P-500, but most steer clear of Pakistan. In the media, the country’s name is often followed by Osama bin Laden, Taliban, sectarian violence, protests and blackouts. However, Pakistan has also been making significant progress on the economic front and may very well be, in the words of Renaissance Capital’s chief economist Charlie Robertson, “the best, undiscovered investment opportunity in emerging or frontier markets.” Pakistan was created back in 1947 following its partition with India. But unlike its bigger neighbor, the political setup in Pakistan has been far from stable, thanks to corrupt politicians and frequent military takeovers. However, democracy has been taking hold following the departure of the last military ruler Pervez Musharraf in the 2008 general elections. In 2013, for the first time in its turbulent history, a civilian government successfully completed its term in office and transferred power to another. Those elections paved the way for the pro-business politician Nawaz Sharif to form a government. Sharif immediately moved to stabilize the economy, bolster public finances, lift foreign reserves and increase infrastructure spending. Although there is significant room for improvement, so far, the Pakistani government’s performance has been impressive, which was also acknowledged by the IMF. Besides, the country has received positive commentary from Moody’s and Standard & Poor’s. The two rating agencies have recently upgraded Pakistan’s credit rating. Betting on Pakistan’s future is its strongest ally China which has planned to inject $46 billion into South Asia’s second leading economy. China’s confidence stems partly from Pakistan’s latest, and perhaps its biggest, military offensive against the local militants. The country’s security situation, which has been one of the biggest concerns for foreign investors, has improved dramatically. Last year, Pakistan witnessed the lowest number of civilian casualties in terrorist attacks over the last seven years, and the number has improved considerably this year. Meanwhile, Pakistan’s economic growth has improved from 3.7% in 2013 to 4.1% in 2014. The economy currently appears to be posting its strongest growth since the global financial crisis while inflation has been slowing down over the last twelve months, dropping to their lowest level since 2013 of 2.1% in April due in part to the slump in oil prices. The foreign exchange reserves on the other hand, have climbed to their highest level ever of $18.2 billion. Meanwhile, the Sharif government has been doubling down on the construction and infrastructure sector. This has led to a construction boom which is driving the economic growth. As per data from Bloomberg, in the last fiscal year, the nation’s cement stocks have climbed by 57%, outperforming the benchmark index by three times. For the current fiscal year, the government has raised infrastructure spending by 27% to Rs 1.5 trillion/$14.74 billion, which will play an important part in fueling the country’s growth. As per IMF’s projections, growth is expected to tick up to 4.5% in the current fiscal year beginning July 1. With improving economic outlook, Pakistan’s stock markets have rallied. The Karachi Stock Exchange, the nation’s biggest and most liquid market, has generated one of the highest returns in the world over the last five years. During this period, the KSE 100 index has climbed by a whopping 200%. For the fiscal year ending June, the benchmark KSE-100 index has climbed by 14.9%, becoming one of the top performing markets of the world, despite declines coming from oil and gas, tobacco, telecom and banking sectors. Despite the rally, Pakistani stocks are still priced at a discount to their MSCI frontier market peers Bangladesh, Sri Lanka, and Vietnam. A great way for U.S. based investors to gain direct exposure to Pakistani stock markets is through the recently launched Global X MSCI Pakistan ETF (NYSEARCA: PAK ) – the only ETF that is tracking this frontier market. This can be a good diversification tool, since Pakistani stocks showed zero correlation with the S&P-500 last year. The $2.3 million fund, which charges just 0.88%, gives investors exposure to 33 of Pakistan’s leading companies, most of which operate in the financial, energy and materials sector. The fund’s top holdings include two of the country’s largest banks – MCB Bank and Habib Bank-as well as the top E&P company OGDCL, leading chemical fertilizer producer Fauji Fertilizer and the biggest producer and exporter of cement Lucky Cement. These five companies, which give Global X MSCI Pakistan ETF exposure to four diverse sectors, represent 44% of the fund. Disclosure: I/we have no positions in any stocks mentioned, and no plans to initiate any positions within the next 72 hours. (More…) I wrote this article myself, and it expresses my own opinions. I am not receiving compensation for it (other than from Seeking Alpha). I have no business relationship with any company whose stock is mentioned in this article.

The PowerShares S&P 500 Low Volatility Portfolio ETF: Taming The Shrew?

An S&P tracking fund that ‘filters out’ volatile S&P issuers and tempers overall volatility. The fund has proven itself with consistent dividends and share appreciation. Incepted in May 2011, the fund has yet to be proven in a bear market. In the dialogue of ” The Taming of the Shrew” , Gremio famously asks , ” But will you woo this wild-cat? ” Gremio must have surely understood investing! You see, trying to tame portfolio volatility is like wooing a wildcat. However, as many an investor has discovered, there’s no attaining above average returns without taking higher volatility risks. According to Investopedia, “Alpha is one of five technical risk ratios; the others are beta, standard deviation, R-squared and Sharpe ratio” and that Alpha is, ” the excess return of the fund relative to the return of the benchmark index. ” Every passionate investor seeks Alpha through ” a course of learning and ingenious studies,… though time seem so adverse and means unfit .” Another technical risk ratio, ” Beta “, is the measure of volatility relative to the market. In brief, it’s a statistical relationship measuring the volatility of an asset relative to the market as a whole; i.e., to a benchmark. The benchmark is assigned a beta of 1. A beta of less than 1 means that the asset is less volatile than the market and a beta greater than 1 means that the asset is more volatile than the market. Beta is best thought of as the expected percentile change of an asset’s value relative to a benchmark change. After a little thought a prudent investor is certain to ask whether it’s possible, through careful selection of low volatility stocks, to produce above average results. In other words, can low beta produce high alpha? A passionate retail investor might even attempt to construct such a portfolio but generally speaking it would be quite a task. So it begs the question, whether there are ETF products available to satisfy this requirement. There are at least 20 volatility focused ETFs. These include those focused on the Russell 2000 and Russell 1000, S&P 500 enhanced volatility, rate-sensitive low volatility, Japanese, European, International Developed Market, Emerging Market and Global volatility focused funds. There’s one plain vanilla ETF that seems to focus simply S&P 500 low volatility. That is the PowerShares S&P 500 Low Volatility Portfolio ETF (NYSEARCA: SPLV ). According to Invesco: The PowerShares S&P 500 ® Low Volatility Portfolio is based on the S&P 500 ® Low Volatility Index… …The Index is compiled, maintained and calculated by Standard & Poor’s and consists of the 100 stocks from the S&P 500 ® Index with the lowest realized volatility over the past 12 months… The fund remains at least 90% invested at all times. Since the fund’s objective is to track low volatility, it’s a good idea to see how volatility is distributed throughout the fund. It’s said that a picture is worth a thousand words so the following table tells quite a story. The question becomes just how to describe the volatility by sector. To this end, a simplified version of beta is constructed by determining a simple average beta of the fund and it’s sectors and then comparing it with the entire S&P 500. This may be accomplished through the use of the corresponding individual Select Sector SPDR S&P ETFs. Average Beta Per Sector Sector Average Beta Consumer Discretionary 0.990 Sonsumer Staples 0.878 Financials 0.864 Health Care 0.858 Industrials 0.761 Technology* 0.670 Materials 0.893 Utilities 0.220 Energy 0.000 Average 0.682 According to Select Sector SPDR; … Each Select Sector Index is calculated using a modified “market capitalization” methodology. This formula ensures that each of the component stocks within a Select Sector Index is represented in a proportion consistent with its percentage of the total market cap of that particular index. However, all nine Select Sector SPDRs are diversified mutual funds with respect to the Internal Revenue Code. As a result, each Sector Index will be modified so that an individual security does not comprise more than 25% of the index… According to the Select Sector prospectus these are actively managed funds and are focused on tracking the entire sector regardless of volatility . It’s then becomes a simple matter to table and compare each sector’s beta. The S&P 500 is divided into 9 sectors. The fund is also divided into nine sectors but in a different way. The companies in the fund’s IT and Telecom sectors are included under the single heading of the S&P ‘technology sector’. Also, SPLV omits the energy sector completely. Hence, in order to create a 1-1 correspondence, the IT and Telecom sectors are combined and an entry of 0.00 is assigned to the energy sector. Beta Comparison Table Sector SPLV Weight SPLV Beta SPDR Beta Consumer Discretionary 6.504% 0.990 1.050 Consumer Staples 21.028% 0.878 0.610 Financials 35.413% 0.864 1.270 Health Care 11.195% 0.858 0.690 Industrials 14.083% 0.761 1.200 Technology* 6.355% 0.670 1.000 Materials 2.832% 0.893 1.290 Utilities 2.596% 0.220 0.250 Energy 0.000% 0.000 1.340 Average SPLV Beta 0.682 It is plain to see from the table that in some cases, the SPDR Sector Fund actually has a lower beta than does the SPLV sector. It is important to observe also, the Select Sector SPDR funds have far more holdings in each portfolio. For example, the SPLV financial sector includes 35 holdings and a beta of 0.864. On the other hand, the Select Sector SPDR Financial Sector fund, XLF has 88 holdings, essentially the entire S&P financial sector, with a beta of 1.27. What about SPLV’s performance when compared to the entire S&P 500? This is accomplished through the use of the SPDR S&P 500 Trust ETF (NYSEARCA: SPY ) which tracks the performance of the S&P 500. ETF Shares 1 Month YTD 1 Year 3 Year From 5-5-2011 SPY -2.17% 0.87% 5.09% 53.20% 54.86% SPLV -0.72% -2.19% 4.86% 34.53% 46.69% In the volatile month of June, SPLV did prove its mettle, losing a mere -0.72% versus a -2.17% loss for the unrestricted S&P tracking SPY. Year to date SPY was virtually unchanged with a 0.87% gain whereas the more defensive SPLV was down; -2.19%. This is more than should have been expected. Having an average 68% of the volatility of the S&P, SPLV should have returned at least a positive 0.59%. Over one year, it was nearly even with the unrestricted S&P tracking ETF. Over three years, the SPLV low volatility shares returned 34.53%, which works out to about 64.90% of the 53.20% return of the market tracking SPY shares. Hence, in the expectation ballpark. Lastly, from the inception date of May 11, 2011, SPLV outperformed its expectations with a 46.69 return vs. the unrestricted SPY’s 54.86%. Having an average of 68% of the S&P volatility, a 37.30% returned would have been expected. These are market price comparisons which do not include the $3.5381 total dividends distributed since the May 5, 2011 inception date. (click to enlarge) The question then becomes whether holding a low volatility S&P fund is worth the sacrifice of some of the upside gains vs. the unrestricted S&P 500? This is difficult to answer since SPLV came to market, as mentioned, in May of 2011 and has yet to prove itself in a real bear market. However, if the correlation of the fund to date is any indication, SPLV may well serve as an excellent ‘ defensive tool ‘ for an investor already in the market. There are many important questions the investor must consider. For example, is it worth the commission cost of reallocating? How much of the investor’s portfolio is really at risk? What will be the short or long term capital gains tax risk? Is there enough free capital at hand to ‘average down’ portfolio holdings in the event of a bear market? There are numerous good reasons to invest in the fund. For example, an investor might be too close to retirement to risk the full volatility of the equities market, but still has several years before the funds are needed, may consider it. Another is too use the fund to protect profits accumulated over the past several years and still participate in the market. It’s also important to note that the fund is marginable and that there are listed options for SPLV. Hence an experienced option investor may use SPLV as an underlying asset in combination with various options strategies. According to the summary prospectus the fund carries 100 holdings, matching the number of holdings in the S&P Low Volatility index and has 127.4 million shares outstanding adding up to a $4.742 billion market cap. However, it should be noted that the fund’s most recent P/E at 19.37% is higher than the unrestricted SPY P/E at 17.46. The fund is currently selling at a very low premium to its underlying NAV at 0.08%. SPLV has paid 43 dividends since inception totaling $3.5381 per share. That works out to 14.1978% of the fund’s closing price on its first day of trading 5/5/2011. Management fees are 0.25%. In summary, it seems that volatility can be indeed be tamed but it is done so at the expense of alpha. However, for those willing to devote themselves to a low volatility S&P fund, nested in a carefully diversified portfolio for the long term, well else can be said other than all’s well that ends well. Disclosure: I/we have no positions in any stocks mentioned, and no plans to initiate any positions within the next 72 hours. (More…) I wrote this article myself, and it expresses my own opinions. I am not receiving compensation for it (other than from Seeking Alpha). I have no business relationship with any company whose stock is mentioned in this article. Additional disclosure: CFDs, spread betting and FX can result in losses exceeding your initial deposit. They are not suitable for everyone, so please ensure you understand the risks. Seek independent financial advice if necessary. Nothing in this article should be considered a personal recommendation. It does not account for your personal circumstances or appetite for risk.