Tag Archives: transactionname

Seeing The Forest Through The Trees; Timber ETFs

In the never ending search for new and interesting betas, perhaps few betas are as unique as that related to wood products. Perhaps apart from the occasional reality TV show, wood and industries related to it, aren’t the trendiest of products these days, but from snazzy car and home interiors, to humble old fashioned writing tablets and pizza boxes, wood, and its derivatives, everywhere one may look. Though the betas of wood ETFs may not be too far away from 1.0 on average ( WOOD ; 1.09, CUT ; 1.22), they may still perhaps supply a portfolio with an interesting route towards further diversification, and hence perhaps deserve a look. ________ Two of the most notable timber ETFs seem to be the surprisingly named WOOD and CUT. Though they are largely similar there seem to be certain qualities of each which make them slightly different from one another, but none the less interesting perhaps. _________ Apart from the year to date returns(price based); 1.86% for CUT, and 2.39% for WOOD, they also have different dividend based yield profiles per se, with W having a ~1.6% div. yield (according to Google finance), and C having a ~2.6 div yield. Apart from these sorts foreground, if one will, differences, the two ETFs also have different geographical allocations as far as their holdings’ are concerned. While Both have a US centric skew to their holdings, CUT seems to ultimately have a lesser percentage of its holdings invested in US based investments. One might argue that from largest to smallest position, WOOD also seems to be more concentrated(albeit slightly) in top holdings more so than CUT as well. These two ETFs share different subsector concentrations as one might expect, but before we get to that lets spice things up with an exciting picture of paper products. _______ For, though WOOD has so far held the crown in so far as skewness is concerned, CUT does show some more skewness in some regards, most specifically in so far as its subsector concentrations are concerned. For, though one may most often associate timber and wood products ETFs with a gentleman “leaping from tree to tree” in the forests of “British Columbia”, this death of the tree per se, is seemingly just the beginning of the flume ride if one will, that wood and its derivatives take through the world of industry. Image Source , Log Flume rides, soaking innocent bystanders at amusement parks since 1963 For when looking at these two wood ETFs one may notice that while WOOD is more concentrated in the paper products sector and “Reits”, presumably timber bearing land, with ~26% of said assets being held in said Reits, CUT seems to just sort of ” cut to the chase”; with a full 80 percent of its holdings specifically being in the “basic materials” subsector, presumably being wood or timberlands in general. Hence if one will it might be said that WOOD seems to be the more paper or wood derivatives centric of the 2 ETFs, with CUT being the more ” wood” centric of the two. Hence for the more specifically timber heavy play if one will, CUT might be the better ultimate choice, with WOOD being the favorite for paper products, etc. Hence perhaps the choice in between which of these two ETFs to allocate some cap., may come down to that age old discussion of wood vs. paper, and hence perhaps in a way perhaps they are, despite some broad overlap, somewhat complimentary. ______ Hence perhaps discussions of timber ETFs are also very much discussion of paper ETFs if one will. Ultimately whether one is looking for the felling of trees, or for some action regarding that semi-ancient medium of human writing etc., hopefully everyone’s investments are doing great, and everyone is having a good summer, and perhaps enjoying a log-flume ride or two, or whatever one chooses as a method to “beat the heat”. Thanks again for reading. ______ Prose of the post; an excerpt of lumberjack poetry; “spilling the fruit and chipping the bark, measuring, cutting into four by fours, and two by sixes,– numbering now instead of naming, until, even the complicitous apple was felled”
Oversold Globally With India As The Outlier

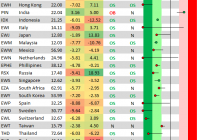
Greece has roiled global equity markets for the time being, and you can see the recent drop in our trading range screen of the 30 largest country ETFs. For each country ETF, the dot represents where it is currently trading, while the tail end represents where it was trading one week ago. The black vertical “N” line represents each ETF’s 50-day moving average, and moves into the red or green zones are considered overbought or oversold. As of Monday afternoon, 26 of the 30 country ETFs in our screen were in oversold territory, with France (NYSEARCA: EWQ ), Germany (NYSEARCA: EWG ), Hong Kong (NYSEARCA: EWH ), Italy (NYSEARCA: EWI ), the Netherlands (NYSEARCA: EWN ), Spain (NYSEARCA: EWP ) and Sweden (NYSEARCA: EWD ) all at extreme levels of 3 or more standard deviations below their 50-days. The US (NYSEARCA: SPY ) is deeply oversold now as well. Interestingly, three countries have managed to buck the trend recently and head higher – India ( PIN , INP ), Singapore (NYSEARCA: EWS ), and Vietnam (NYSEARCA: VNM ). After experiencing a nasty downtrend for months, India’s stock market has actually broken higher above the top end of its downtrend channel recently. Share this article with a colleague

IWM’s 2015 2nd-Quarter Performance And Seasonality

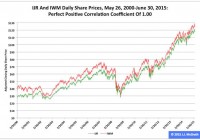
Summary The iShares Russell 2000 ETF behaved better than the iShares Core S&P Small-Cap ETF did in the first half of the year. The former fund also performed better than the latter fund did in the second quarter. However, the converse was the case in June. The iShares Russell 2000 ETF (NYSEARCA: IWM ) and the iShares Core S&P Small-Cap ETF (NYSEARCA: IJR ) both recorded positive returns in the first half, Q2 and June based on their respective adjusted closing daily share prices, which is saying something in the current equity-market environment. IWM led IJR by 66 basis points in the first half as it ascended to $124.84 from $119.26, a climb of $5.58, or 4.68 percent. And IWM outdistanced IJR by 21 basis points in Q2 as it expanded to $124.84 from $124.37, a gain of 47 cents, or 0.38 percent. But the two ETFs switched roles in June, with IWM lagging IJR by -29 basis points as it grew to $124.84 from $123.89, an increase of 95 cents, or 0.77 percent. Comparisons of changes by percentages in IWM, IJR, the SPDR S&P MidCap 400 ETF (NYSEARCA: MDY ), the SPDR S&P 500 ETF (NYSEARCA: SPY ) and PowerShares QQQ (NASDAQ: QQQ ) during the first half, over Q2 and in June can be found in charts published in “SPY’s 2015 2nd-Quarter Performance And Seasonality.” Figure 1: History Of IJR And IWM Daily Share Prices (click to enlarge) Source: This J.J.’s Risky Business chart is based on analyses of adjusted closing daily share prices at Yahoo Finance . Since IWM and IJR were launched May 26, 2000, there has been a perfect positive correlation coefficient between the adjusted closing daily share prices of the two ETFs, which is one reason I believe each is an excellent proxy for the small-capitalization segment of the U.S. equity market (Figure 1). Accordingly, I analyze data associated with both funds in the context of my Risky Business Daily Market Seismometer , as mentioned in “Assessing IWM With The Aid Of The U.S. Economic Index.” Of course, the ETFs are not identical but similar, as evidenced by their behaviors between their shared launch date and June 30, when IJR handily outpaced IWM by 102.54 percentage points. In this period, the fund based on the S&P 600 index rose 333.86 percent and the fund based on the Russell 2000 index rose 231.32 percent. As result, I think the ETFs’ differences are relatively trivial in terms of analysis and absolutely nontrivial in terms of their employment in an investing or trading portfolio. Overvaluation appears to be one characteristic currently shared by both funds’ underlying indexes. I note the Russell 2000’s price-to-earnings ratio on a trailing 12-month basis was calculated as 78.00 July 2, according to Birinyi Associates data published by The Wall Street Journal , and I point out the S&P 600’s valuation was discussed in “IJR’s 2015 2nd-Quarter Performance And Seasonality” here at Seeking Alpha. Figure 2: IWM Monthly Change, 2015 Vs. 2001-2014 Mean (click to enlarge) Source: This J.J.’s Risky Business chart is based on analyses of adjusted closing monthly share prices at Yahoo Finance . IWM behaved a little worse in the first half of this year than it did during the comparable periods in its initial 14 full years of existence based on the monthly means calculated by employing data associated with that historical time frame (Figure 2). The same data set shows the average year’s weakest quarter was the third, with an absolutely large negative return, and its strongest quarter was the fourth, with an absolutely large positive return. Figure 3: IWM Monthly Change, 2015 Vs. 2001-2014 Median (click to enlarge) Source: This J.J.’s Risky Business chart is based on analyses of adjusted closing monthly share prices at Yahoo Finance. IWM performed a lot worse in the first half of this year than it did during the comparable periods in its initial 14 full years of existence based on the monthly means calculated by using data associated with that historical time frame (Figure 3). The same data set shows the average year’s weakest quarter was the third, with an absolutely large negative return, and its strongest quarter was the fourth, with an absolutely large positive return. Disclaimer: The opinions expressed herein by the author do not constitute an investment recommendation, and they are unsuitable for employment in the making of investment decisions. The opinions expressed herein address only certain aspects of potential investment in any securities and cannot substitute for comprehensive investment analysis. The opinions expressed herein are based on an incomplete set of information, illustrative in nature, and limited in scope. In addition, the opinions expressed herein reflect the author’s best judgment as of the date of publication, and they are subject to change without notice. Disclosure: I/we have no positions in any stocks mentioned, and no plans to initiate any positions within the next 72 hours. (More…) I wrote this article myself, and it expresses my own opinions. I am not receiving compensation for it (other than from Seeking Alpha). I have no business relationship with any company whose stock is mentioned in this article.