Scalper1 News
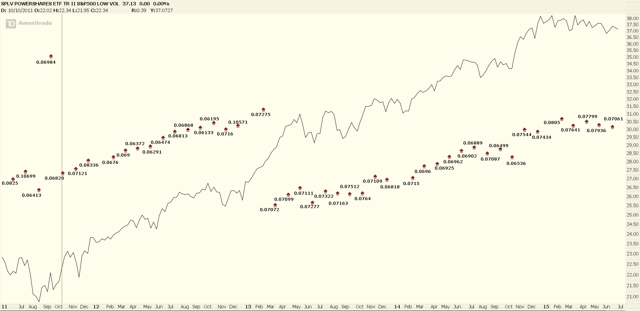 An S&P tracking fund that ‘filters out’ volatile S&P issuers and tempers overall volatility. The fund has proven itself with consistent dividends and share appreciation. Incepted in May 2011, the fund has yet to be proven in a bear market. In the dialogue of ” The Taming of the Shrew” , Gremio famously asks , ” But will you woo this wild-cat? ” Gremio must have surely understood investing! You see, trying to tame portfolio volatility is like wooing a wildcat. However, as many an investor has discovered, there’s no attaining above average returns without taking higher volatility risks. According to Investopedia, “Alpha is one of five technical risk ratios; the others are beta, standard deviation, R-squared and Sharpe ratio” and that Alpha is, ” the excess return of the fund relative to the return of the benchmark index. ” Every passionate investor seeks Alpha through ” a course of learning and ingenious studies,… though time seem so adverse and means unfit .” Another technical risk ratio, ” Beta “, is the measure of volatility relative to the market. In brief, it’s a statistical relationship measuring the volatility of an asset relative to the market as a whole; i.e., to a benchmark. The benchmark is assigned a beta of 1. A beta of less than 1 means that the asset is less volatile than the market and a beta greater than 1 means that the asset is more volatile than the market. Beta is best thought of as the expected percentile change of an asset’s value relative to a benchmark change. After a little thought a prudent investor is certain to ask whether it’s possible, through careful selection of low volatility stocks, to produce above average results. In other words, can low beta produce high alpha? A passionate retail investor might even attempt to construct such a portfolio but generally speaking it would be quite a task. So it begs the question, whether there are ETF products available to satisfy this requirement. There are at least 20 volatility focused ETFs. These include those focused on the Russell 2000 and Russell 1000, S&P 500 enhanced volatility, rate-sensitive low volatility, Japanese, European, International Developed Market, Emerging Market and Global volatility focused funds. There’s one plain vanilla ETF that seems to focus simply S&P 500 low volatility. That is the PowerShares S&P 500 Low Volatility Portfolio ETF (NYSEARCA: SPLV ). According to Invesco: The PowerShares S&P 500 ® Low Volatility Portfolio is based on the S&P 500 ® Low Volatility Index… …The Index is compiled, maintained and calculated by Standard & Poor’s and consists of the 100 stocks from the S&P 500 ® Index with the lowest realized volatility over the past 12 months… The fund remains at least 90% invested at all times. Since the fund’s objective is to track low volatility, it’s a good idea to see how volatility is distributed throughout the fund. It’s said that a picture is worth a thousand words so the following table tells quite a story. The question becomes just how to describe the volatility by sector. To this end, a simplified version of beta is constructed by determining a simple average beta of the fund and it’s sectors and then comparing it with the entire S&P 500. This may be accomplished through the use of the corresponding individual Select Sector SPDR S&P ETFs. Average Beta Per Sector Sector Average Beta Consumer Discretionary 0.990 Sonsumer Staples 0.878 Financials 0.864 Health Care 0.858 Industrials 0.761 Technology* 0.670 Materials 0.893 Utilities 0.220 Energy 0.000 Average 0.682 According to Select Sector SPDR; … Each Select Sector Index is calculated using a modified “market capitalization” methodology. This formula ensures that each of the component stocks within a Select Sector Index is represented in a proportion consistent with its percentage of the total market cap of that particular index. However, all nine Select Sector SPDRs are diversified mutual funds with respect to the Internal Revenue Code. As a result, each Sector Index will be modified so that an individual security does not comprise more than 25% of the index… According to the Select Sector prospectus these are actively managed funds and are focused on tracking the entire sector regardless of volatility . It’s then becomes a simple matter to table and compare each sector’s beta. The S&P 500 is divided into 9 sectors. The fund is also divided into nine sectors but in a different way. The companies in the fund’s IT and Telecom sectors are included under the single heading of the S&P ‘technology sector’. Also, SPLV omits the energy sector completely. Hence, in order to create a 1-1 correspondence, the IT and Telecom sectors are combined and an entry of 0.00 is assigned to the energy sector. Beta Comparison Table Sector SPLV Weight SPLV Beta SPDR Beta Consumer Discretionary 6.504% 0.990 1.050 Consumer Staples 21.028% 0.878 0.610 Financials 35.413% 0.864 1.270 Health Care 11.195% 0.858 0.690 Industrials 14.083% 0.761 1.200 Technology* 6.355% 0.670 1.000 Materials 2.832% 0.893 1.290 Utilities 2.596% 0.220 0.250 Energy 0.000% 0.000 1.340 Average SPLV Beta 0.682 It is plain to see from the table that in some cases, the SPDR Sector Fund actually has a lower beta than does the SPLV sector. It is important to observe also, the Select Sector SPDR funds have far more holdings in each portfolio. For example, the SPLV financial sector includes 35 holdings and a beta of 0.864. On the other hand, the Select Sector SPDR Financial Sector fund, XLF has 88 holdings, essentially the entire S&P financial sector, with a beta of 1.27. What about SPLV’s performance when compared to the entire S&P 500? This is accomplished through the use of the SPDR S&P 500 Trust ETF (NYSEARCA: SPY ) which tracks the performance of the S&P 500. ETF Shares 1 Month YTD 1 Year 3 Year From 5-5-2011 SPY -2.17% 0.87% 5.09% 53.20% 54.86% SPLV -0.72% -2.19% 4.86% 34.53% 46.69% In the volatile month of June, SPLV did prove its mettle, losing a mere -0.72% versus a -2.17% loss for the unrestricted S&P tracking SPY. Year to date SPY was virtually unchanged with a 0.87% gain whereas the more defensive SPLV was down; -2.19%. This is more than should have been expected. Having an average 68% of the volatility of the S&P, SPLV should have returned at least a positive 0.59%. Over one year, it was nearly even with the unrestricted S&P tracking ETF. Over three years, the SPLV low volatility shares returned 34.53%, which works out to about 64.90% of the 53.20% return of the market tracking SPY shares. Hence, in the expectation ballpark. Lastly, from the inception date of May 11, 2011, SPLV outperformed its expectations with a 46.69 return vs. the unrestricted SPY’s 54.86%. Having an average of 68% of the S&P volatility, a 37.30% returned would have been expected. These are market price comparisons which do not include the $3.5381 total dividends distributed since the May 5, 2011 inception date. (click to enlarge) The question then becomes whether holding a low volatility S&P fund is worth the sacrifice of some of the upside gains vs. the unrestricted S&P 500? This is difficult to answer since SPLV came to market, as mentioned, in May of 2011 and has yet to prove itself in a real bear market. However, if the correlation of the fund to date is any indication, SPLV may well serve as an excellent ‘ defensive tool ‘ for an investor already in the market. There are many important questions the investor must consider. For example, is it worth the commission cost of reallocating? How much of the investor’s portfolio is really at risk? What will be the short or long term capital gains tax risk? Is there enough free capital at hand to ‘average down’ portfolio holdings in the event of a bear market? There are numerous good reasons to invest in the fund. For example, an investor might be too close to retirement to risk the full volatility of the equities market, but still has several years before the funds are needed, may consider it. Another is too use the fund to protect profits accumulated over the past several years and still participate in the market. It’s also important to note that the fund is marginable and that there are listed options for SPLV. Hence an experienced option investor may use SPLV as an underlying asset in combination with various options strategies. According to the summary prospectus the fund carries 100 holdings, matching the number of holdings in the S&P Low Volatility index and has 127.4 million shares outstanding adding up to a $4.742 billion market cap. However, it should be noted that the fund’s most recent P/E at 19.37% is higher than the unrestricted SPY P/E at 17.46. The fund is currently selling at a very low premium to its underlying NAV at 0.08%. SPLV has paid 43 dividends since inception totaling $3.5381 per share. That works out to 14.1978% of the fund’s closing price on its first day of trading 5/5/2011. Management fees are 0.25%. In summary, it seems that volatility can be indeed be tamed but it is done so at the expense of alpha. However, for those willing to devote themselves to a low volatility S&P fund, nested in a carefully diversified portfolio for the long term, well else can be said other than all’s well that ends well. Disclosure: I/we have no positions in any stocks mentioned, and no plans to initiate any positions within the next 72 hours. (More…) I wrote this article myself, and it expresses my own opinions. I am not receiving compensation for it (other than from Seeking Alpha). I have no business relationship with any company whose stock is mentioned in this article. Additional disclosure: CFDs, spread betting and FX can result in losses exceeding your initial deposit. They are not suitable for everyone, so please ensure you understand the risks. Seek independent financial advice if necessary. Nothing in this article should be considered a personal recommendation. It does not account for your personal circumstances or appetite for risk. Scalper1 News
Scalper1 News