Tag Archives: transactionname

2 Big Investments Begin To Pay Off For The Laclede Group

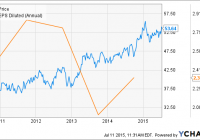
Summary Natural gas utility holding company, The Laclede Group, has seen two recent acquisitions pay off in the form of earnings growth following a period of stagnation. The acquisition of Alabama utility, Alagasco, has proven especially valuable due to that state’s favorable regulatory scheme and a likely colder-than-average upcoming winter there. Economic weakness in Missouri and Alabama could reduce the firm’s consolidated earnings growth, however, if it proves to be sustained. A solid dividend history aside, the company’s 3.4% forward yield is not sufficient to overcome economic weakness and high share valuations in making it an attractive investment at this time. The Laclede Group (NYSE: LG ) is a St. Louis-based public utility holding company that operates both regulated and non-regulated natural gas distribution and marketing operations via wholly-owned subsidiaries. In addition to distributing natural gas to more than 1 million customers across its subsidiaries, the company also has 48 Bcf of natural gas and propane storage capacity. The Laclede Group has been on a buying spree in recent years, purchasing in-state peer, Missouri Gas Company, in 2013 and Alabama utility, Alagasco, in 2014. Both moves required it to greatly expand its debt load and caused its earnings to decline on a non-adjusted basis. More recently the acquisitions have begun to deliver earnings growth of their own, however, and the company’s share price is well above its 52-week low (see figure), defying broader sector performance. This article evaluates The Laclede Group as a potential long investment. LG data by YCharts The Laclede Group at a glance The Laclede Group distributes natural gas to customers via three regulated subsidiary utilities. The original is Laclede Gas Co., which is the largest natural gas distribution utility in the state of Missouri with 16,000 miles of main and service lines. It has 642,000 customers in St. Louis and east Missouri as well as 30 Bcf of natural gas and propane storage capacity and a propane vaporization facility. Missouri Gas Energy, which was purchased in 2013, provides natural gas to another 500,000 customers in Kansas City and west Missouri. Finally, Alagasco (aka Alabama Gas Corp.), which is the largest natural gas utility in the state of Alabama, distributes natural gas to 419,000 customers in 200 Alabama communities. The Laclede Group also operates several unregulated subsidiaries, the largest of which is Laclede Energy Resources, which provides non-regulatory natural gas services including marketing, and Laclede Pipeline Co., which transports propane between storage facilities in Missouri and Illinois. The regulated subsidiaries generate the overwhelming majority of the parent company’s earnings, however, reaching 98% in the TTM period. Laclede Gas Co. and Missouri Gas Energy both operate under the same favorable regulatory scheme. The Laclede Group has benefited from this consistency and reported a natural gas utility adjusted EPS CAGR of 14.8% between FY 2010 and FY 2014, with the increase being mostly driven by heavy investment in natural gas infrastructure. The holding company has reported adjusted EPS growth in four of its last five fiscal years, with flat growth being reported for the fifth year. This consistent performance goes back beyond the last five years, with The Laclede Group boasting 70 consecutive years of dividend payments, although its most recent performance has enabled it to provide 12 consecutive years of dividend increases. Its most recent increase of 4.5%, which was announced last November, resulted in a quarterly dividend of $0.46, or a 3.4% forward yield at the time of writing. The company targets a dividend payout ratio of 55%-65%, a range that it has largely maintained over the last five years even as its dividend as increased by 16% over the same period (see figure). LG Payout Ratio (NYSE: TTM ) data by YCharts FQ2 earnings report The Laclede Group reported the results of its fiscal Q2 for the period ending March 31, 2015, in May. The company reported revenue of $877.4 million, up 26.3% YoY, due to the fact that the Alagasco operations appeared on the latest quarter’s income statement. The result missed the consensus estimated by $90 million , however. The strongest performers were the subsidiary utilities, with natural gas utility revenue increasing by 53.5% YoY to $847 million, or 96.4% of total consolidated revenue as a result of the Alagasco acquisition. Natural gas marketing revenue fell by 49.4% compared to the previous year $30.4, however, mainly due to the presence of normal weather (FQ2 temperatures were 10% warmer YoY on average, albeit 6% colder than the long-term average) and lower natural gas prices in the most recent FQ2 than before. Operating income also rose strongly YoY to $157.7 million from $87.2 million. While much of this gain was again due to Alagasco, operating expense only rose by 18.5% YoY to $719.7 million, or $76.5 million less of an increase than was reported for revenue. The Laclede Group reported that its legacy operating income increased by $13.9 million compared to the previous year due to the introduction of new, more favorable rates in Missouri. Consolidated net income came in at $94.4 million, up 80% YoY from $52.2 million (see table). More importantly, EPS came in at $2.18, up from $1.59 the previous year despite the issuance of 11 million common shares to help finance the Alagasco acquisitions in the interim. Adjusted net income, which excluded $1.5 million in one-time acquisition-related expenses and $1.7 million in a fair value adjustment resulting from unrealized derivative losses, rose still higher to $97.6 million from $51.7 million YoY. Adjusted EPS (or “net economic earnings” in the company’s parlance) came in at $2.25 compared to $1.58 YoY, beating the consensus estimate by $0.12. The Laclede Group Financials (non-adjusted) FQ2 2015 FQ1 2015 FQ4 2014 FQ3 2014 FQ2 2014 Revenue ($MM) 877.4 619.6 222.3 241.8 694.5 Gross income ($MM) 394.6 254.4 (59.9) 192.5 289.2 Net income ($MM) 94.4 47.1 (14.9) 11.7 52.2 Diluted EPS ($) 2.18 1.09 (0.34) 0.33 1.59 EBITDA ($MM) 43.2 43.2 43.4 35.0 32.6 Source: Morningstar (2015). The company has been investing heavily in modernizing its existing distribution pipelines, resulting in much higher capex in the previous two quarters than before. It expects its FY 2015 capex to reach $300 million, with half of this being spent on pipeline replacement, up from $170 million in FY 2014. Due to the residual effects of the aforementioned debt increase and secondary equity offering, however, The Laclede Group ended FQ2 with $46.9 million, up from $10.9 million at the end of FQ2 2014. Its current ratio fell sharply over the course of the previous four quarters from 1.29 to 0.75, however, primarily due to a $290 million increase to short-term debt. While the current ratio isn’t nearly as important to regulated utilities with their steady cash flows than non-regulated firms, this is still something for investors to keep an eye on in coming quarters. Long-term debt increased by $903.2 million YoY to $1.7 billion to fund the Alagasco acquisition. Fortunately for investors, this investment yielded a 98% operating cash flow increase YoY, yielding a result of $314 million in the most recent quarter. Furthermore, the company has maintained fairly strong credit ratings ranging from BBB+ to A by S&P, and it has $750 million in consolidated liquidity available from existing credit facilities. $1.7 billion is also not an especially large debt load for a firm of the company’s size, mitigating concerns that rising interest rates later in the year could reduce its earnings. The Laclede Group’s most recent acquisition is more than capable of servicing the large debt taken on to complete it. Outlook The Laclede Group’s management had initially provided guidance of long-term adjusted EPS growth of 4% to 6%. The company now expects to exceed this pace in FY 2015 and possibly FY 2016 on a weather-normalized basis. This earnings growth is to be maintained via $1.5 billion in total capex through FY 2019, or $300 million in annual capex, mainly in the form of distribution infrastructure investment and expansion. The Laclede Group operates under two different regulatory schemes, both of which are favorable in their own ways. Missouri employs a traditional regulatory scheme under which rate cases are filed every three years. This lack of regulatory flexibility is offset by weather-normalization mechanisms and rapid recovery mechanisms for pipeline replacements, the latter of which allows The Laclede Group to recapture infrastructure upgrade costs every six months. The company should expect to quickly see its large planned pipeline replacement costs recaptured via higher rate bases through FY 2019 as a result. Alabama employs a very flexible regulatory scheme under which rate filings are made annually on a forward basis and multiple cost recapture mechanisms are provided. While this flexibility can result in lower allowed ROEs, the state’s scheme currently provides a substantially higher allowed ROE to Alagasco (10.8%) than Missouri provides to either Laclede Gas (9.7%) or Missouri Gas (9.8%). The Laclede Group’s overall achieved ROE has been a cause for concern of late. Missouri was hit hard by the Great Recession as its unemployment rate almost reached the double-digits and the company’s consolidated ROE ultimately peaked at 11.5% in FY 2011 before steadily declining. It didn’t even reach 7% in FY 2013 and FY 2014 and, while this was in part due to one-time acquisition costs that reduced non-adjusted net income, a period of non-existent earnings growth also was responsible. The Alagasco acquisition pushed this above 10% TTM on both adjusted and non-adjusted bases, indicating the wisdom of the move despite its risks. While it would be better still to see the company’s Missouri operations achieve ROEs closer to their allowed ROEs, Alagasco is positioned to drive overall earnings growth for The Laclede Group. This is ultimately important because both Missouri and Alabama have seen their economies weaken of late. The unemployment rate in both states recently increased and are now above the U.S. average after being well below it over the previous five years (see figure). Likewise, GDP growth in both states has slackened and their economies are no longer growing as quickly as the country’s (see second figure). This is especially a concern for the firm’s Missouri operations, as earnings growth disappeared on an adjusted basis when that state’s unemployment rate stabilized. It is too early to say that earnings growth from the Missouri operations will decrease, of course, but it is a potential concern for investors. Missouri Unemployment Rate data by YCharts Missouri Change in GDP data by YCharts Weather-related factors could cause the company’s Alabama operations to be an outsized contributor to its consolidated earnings in the coming quarters due to the presence of El Niño conditions. After missing an expected appearance in 2014, the phenomenon is now expected to be one of the strongest in the last 50 years this winter. El Niño events have historically been associated with above average winter temperatures in the northern half of the U.S. and below average temperatures in the southern half. NOAA reviewed historical events back in the 1990s and determined that Missouri experiences warmer-than-average temperatures in Q4 while Alabama experiences colder-than-average temperatures in Q1 during El Niños. The fact that all of The Laclede Group’s operations reside in the southern half of the country means that even record cold in Alabama would be unlikely to result in a tremendous surge to natural gas demand there, of course (a 47 degree F winter average temp is downright balmy for those of us raised in the Midwest), but it can be expected to boost demand. Whether this increase will offset reduced demand in Missouri remains to be seen, however, and it is possible that the net effect of El Niño on the company’s winter operations is zero. Valuation Analyst estimates for The Laclede Group have increased slightly over the last 90 days in response to the company’s better-than-expected FQ2 results. The FY 2015 adjusted EPS consensus estimate has increased from $3.16 to $3.17 while the FY 2016 estimate has increased from $3.35 to $3.38. Based on its share price at the time of writing of $53.64, the company is trading at trailing P/E ratios of 16.5x and 14.6x on non-adjusted and adjusted bases, respectively, and forward ratios for FY 2015 and FY 2016 of 16.9x and 15.9x, respectively. While lower than for some firms in the gas utilities sector, these ratios are all near the top of their respective 5-year ranges (see figure). The company’s share price does not appear to be undervalued at present, although expected earnings growth in FY 2016 prevents them from being clearly overvalued either. LG PE Ratio ( TTM ) data by YCharts Conclusion Acquisitions of peers in Missouri and Alabama provided natural gas utility holding company The Laclede Group with a substantial earnings boost in Q1 following a period of stagnation. Hindsight makes the latter investment in particular look positive due to Alagasco’s especially favorable regulatory scheme and the prospect of a colder-than average Alabama 2015/2016 winter resulting from a very strong El Niño event. This advantage could be offset by signs of economic weakness in both Missouri and Alabama, although it is too early to say whether or not this development will be sustained enough to negatively impact the company’s expected earnings growth. While consistent dividend growth, favorable regulatory schemes, and large planned capex provide support for management’s earnings growth guidance, conservative investors should require a margin of safety in the form of undervalued shares to compensate for the aforementioned economic weakness and The Laclede Group’s pre-acquisitions ROE weakness. Such a margin is not available at present, however, following share price strength, especially compared to the broader gas utilities sector over the last year. I recommend that potential investors wait for the share price to fall to 14x forward earnings ($47.32 based on the current FY 2016 estimate) before reevaluating the company as a potential long investment. Disclosure: I/we have no positions in any stocks mentioned, and no plans to initiate any positions within the next 72 hours. (More…) I wrote this article myself, and it expresses my own opinions. I am not receiving compensation for it (other than from Seeking Alpha). I have no business relationship with any company whose stock is mentioned in this article.

The Chinese Government Just Rigged The Market In Your Favor

Summary The Chinese government has taken unprecedented measures to support its A-shares market. Both intuition and history indicate that these measures will likely be successful. Buy A-shares now, or on any dip. The Chinese stock market crash has been making headlines recently, with much of the focus being on the government’s unsuccessful and seemingly desperate efforts to engineer a reversal. From cutting interest rates and reserve ratios, to suspending new IPOs and directing various government entities to purchase shares, nothing seemed to work. Eventually, the People’s Bank of China began providing “unlimited liquidity” to state-owned China Securities Finance Corp in order to fund stock purchases. History has taught us that when central banks print money in order to buy publicly traded assets, the prices of those assets go up relative to the currency being printed. So this on its own was a very big deal. While it was becoming increasingly clear that the Chinese government really , really wants their mainland stock market to go up, their next move was so heavy-handed, and so fundamentally alters the risk-reward calculus for owning Chinese stocks, that it all but guarantees a profit for anyone buying A-shares (NYSEARCA: ASHR ). China makes it illegal to sell stocks On July 8, 2015, the China Securities Regulatory Commission (CSRC) announced that directors, supervisors, senior management personnel, and anyone with more than 5% of the stock outstanding in a company, are not allowed to sell their shares for the next 6 months . This is in addition to having already directed state-owned pension funds, insurance companies, securities firms and other institutions to buy and hold shares. Private companies are not allowed to sell equity because IPOs are frozen. Public companies have been instructed not to sell and are required to submit reports on measures they will take to support their share price. The 21 largest Chinese brokerages have pledged to buy stock and not sell any of it until the Shanghai Composite goes above 4500. China Investment Corporation, the country’s sovereign wealth fund, has begun purchasing Chinese ETFs. You get the picture. All of these people and entities are forbidden from selling. You’re kidding me If this sounds incredible, keep in mind that the Chinese government has immense power over its people and is not shy about exercising its authority in ways that the West might consider uncouth. This is the same government that filters internet search results and imprisons non-violent political dissidents. Recognizing that the sell-off in A-shares was caused by the fear of losing money, the Chinese government has decided to counter this fear with the greater fear of being imprisoned, tortured and sent to a forced labor camp . The Ministry of Public Security has already launched investigations into “malicious shortselling” of Ping An ( OTCPK:PIAIF ) and PetroChina (NYSE: PTR ) stock on July 8th. So who can sell? Individual investors, who hold 25.03% of A-shares by market cap , can sell unless they fall under the CSRC’s definition of an insider as mentioned above. Professional institutions make up only 14.22% of the A-shares market cap, and only some of them, including qualified foreign institutional investors, can sell. Judging from the CSRC data below, I estimate that less than 10% of professional institutions would be able to sell without being charged with a crime. The rest of the market cap is owned by general institutions, which cannot sell . We can thereby deduce that less than 35% of the A-shares market cap is held by entities which are not prohibited from selling. We then need to halve this number because more than half of all stocks on the Shanghai and Shenzhen exchanges have been halted . Thus, less than 17.5% of the A-shares market cap is now available to be sold. Supply and Demand To sum it up, the supply of A-shares available to be sold has been dramatically reduced by government edict and the demand for A-shares has been dramatically increased by government purchasing. Anyone who has taken an introductory course in microeconomics knows that a decrease in supply or an increase in demand, much less a simultaneous occurrence of both, will cause the price of the good in question to go up. Which is why on July 9, 2015, the Shanghai Composite had its biggest daily gain since 2009. If only a minority of people can sell, and the government is printing money to buy everything in sight, then the supply of stock certificates not held by the government will decrease, and thereby command progressively greater prices. In other words, China is now the mother of all “low float rockets,” a colloquialism often used in the momentum investing community. Chinese stock exchanges impose a 10% limit on daily price increases, and only three trading days have elapsed since the government first announced its ban on selling. This means that there is still plenty of upside remaining as the government continues to push share prices to levels that reflect their narrative of an intact bull market. Valuation It is worth noting that valuation metrics on the Shanghai Composite appear cheap, and are nowhere near previous highs: (click to enlarge) Legendary investor Jim Rogers began buying the dip as early as June 26th . Goldman Sachs, Fidelity, and many others have recently turned bullish. Investment Thesis However, valuation is not at all important to my investment thesis, which is instead based on two very simple premises: 1) The Chinese government wants Chinese stock prices to rise and 2) The Chinese government is capable of causing Chinese stock prices to rise. If you believe these two statements are true, then by necessity, the Chinese stock market must go up. There are a myriad of reasons for why the Chinese government wants to rescue its stock market: avoiding financial contagion , transforming into a consumer-driven economy , and keeping their citizens from revolting , to name a few. Their actions, however, are what speak volumes about how serious and committed they are to this cause. I believe that they are willing to do whatever it takes to make their stock market go up, and there are rumors that they are readying an even larger fund for direct stock purchases . The second premise, the question of capability, is even more intuitive. The Chinese government has unequivocal authority to regulate assets domiciled in China and traded on Chinese exchanges. Shares in Chinese companies only have value within the context of Chinese corporate law, and because the law is written by the government, and the higher levels of government are not accountable to voters, there is nothing to stop the government from doing whatever they want. Wealthy Chinese shareholders aren’t going to risk imprisonment just to make a few extra yuan. Even if they were stupid enough to try placing a sell order, brokerages are simply refusing to execute those orders . Historical Precedent The media has been a harsh critic of this market intervention, just as they were harshly critical of previous market interventions such as the Federal Reserve’s Quantitative Easing (QE) program and the Hong Kong Monetary Authority’s famous short squeeze of the Hang Seng Index. It’s true that market interventions such as these reduce liquidity and thereby increase fragility and systemic risk. The global asset bubble is something that keeps me awake at night. But regardless of whatever long-term consequences may arise as a result of such market interventions, no one can deny that when central banks print money to buy assets, those assets do rally. (click to enlarge) The closest historical analogue to China’s ban on selling occurred when Japan’s Ministry of Finance instructed its banks not to sell stocks on August 18, 1992. The Nikkei responded by rallying 32% over the next three weeks in a straight, almost uninterrupted line. The chart above is not exhaustive, history is littered with examples of successful market interventions. Some countries such as Taiwan have funds permanently designated for supporting stock prices. Momentum Once investor confidence is restored, rising prices will lead to more rising prices, which will catalyze a second leg to this rally and possibly even reflate the bubble. China does not yet have much of a stock market investing culture, and only 13% of household wealth is invested into its stock market versus about 50% for U.S. households. If Chinese households decide to hop on for the ride, they have ample dry powder to do so. Human beings are genetically predisposed to move in herds, and if it happened before, it can happen again. Risk Factors The government could change their mind and give up on trying to support share prices, which I truly believe will not happen, but anything is possible. It’s also possible that they could lose control of the market, especially if large shareholders figure out a way to sell their holdings without being detected. In order to combat this possibility, the government is asking brokerages to provide the names and national ID numbers of its account holders . The largest risk for foreign retail investors such as the readers of this article, is probably ETF tracking risk. It’s possible that due to half of the A-shares market being halted, ETFs such as ASHR will have trouble tracking their underlying indices. In other words, when Chinese stocks decline, the U.S. traded ETFs that track them could decline by a much greater amount. The opposite is also true. Last Friday, the ChiNext index on the Shenzhen stock exchange rose by 4.11%, but (NYSEARCA: CNXT ), the ETF that aims to track it, rose by 23.32%. A nice surprise for the traders who went long the day before. Disclosure: I am/we are long ASHR. (More…) I wrote this article myself, and it expresses my own opinions. I am not receiving compensation for it (other than from Seeking Alpha). I have no business relationship with any company whose stock is mentioned in this article. Additional disclosure: I am long ASHR in client accounts through my investment management company, Honey Badger Capital Management.

5 Ways To Beat The Market: Part 5 Revisited

Summary •In a series of articles in December 2014, I highlighted five buy-and-hold strategies that have historically outperformed the S&P 500 (SPY). •Stock ownership by U.S. households is low and falling even as the barriers to entering the market have been greatly reduced. •Investors should understand simple and easy to implement strategies that have been shown to outperform the market over long time intervals. •The final of five strategies I will revisit in this series of articles is equal weighing, a contrarian “buy low, sell high” approach to index rebalancing. In a series of articles in December 2014, I demonstrated five buy-and-hold strategies – size, value, low volatility, dividend growth, and equal weighting, that have historically outperformed the S&P 500 (NYSEARCA: SPY ). I covered an update to the size factor published on Wednesday, posted an update to the value factor on Thursday, covered the Low Volatility Anomaly on Friday, and tackled the Dividend Aristocrats yesterday . In that series, I demonstrated that while technological barriers and costs to market access have been falling, the number of households that own stocks in non-retirement accounts has been falling as well. Less that 14% of U.S. households directly own stocks, which is less than half of the amount of households that own dogs or cats , and less than half of the proportion of households that own guns . The percentage of households that directly own stocks is even less than the percentage of households that have Netflix or Hulu . The strategies I discussed in this series are low cost ways of getting broadly diversified domestic equity exposure with factor tilts that have generated long-run structural alpha. I want to keep these investor topics in front of the Seeking Alpha readership, so I will re-visit these principles with a discussion of the first half returns of these strategies in a series of five articles over the next five days. Reprisals of these articles will allow me to continually update the long-run returns of these strategies for the readership. Equal Weighting The S&P 500 Equal Weight Index is a version of the S&P 500 where the constituents are equal weighted as opposed to the traditional market capitalization weighting of the benchmark gauge. Guggenheim S&P 500 Equal Weight ETF (NYSEARCA: RSP ) replicates this alternative weight index. When the equal-weighted version of the index is rebalanced quarterly to return to equal weights, constituents which have underperformed are purchased and constituents which have outperformed are reduced, a contrarian strategy that has produced excess returns relative to the capitalization-weighted S&P 500 index over long-time intervals. Equal-weighting also gives an investor a greater average exposure to smaller capitalization stocks, a risk factor, detailed in the first article in this series , for which investors have historically been compensated with higher average returns. The composition of the equal-weighted index is more consistent with mid-cap stocks, which have historically outperformed large caps. The graph below shows the cumulative return of the S&P 500 Equal Weight Index relative to the cumulative return of the capitalization-weighted S&P 500 Index. (click to enlarge) Research by Plyakha, Uppal, and Vilkov (2012) puts some data behind my narrative that the size factor and contrarian rebalancing drive alpha in equal weighting strategies. Their analysis found that the higher systematic return of equal weighting relative to capitalization-weighted portfolios arose from relatively higher exposure to the size and value factors described in the first two articles in this series. The higher alpha of the equal-weighted strategy was determined to arise from periodic rebalancing, a contrarian strategy that exploits time-series properties of stock returns. The S&P 500 currently has a 17.1% weighting towards its ten largest constituents. Over one-sixth of the value of the broad market gauge is attributable to one-fiftieth of its components. To demonstrate the value of the size factor to equal-weighting, we should see the S&P 500 outperform the S&P 100 over the same twenty-year time interval. The S&P 100 Index, the hundred largest constituents of the S&P 500, trailing the S&P 500 by 11bps per year. If the contrarian rebalancing in equal-weighting also creates alpha, we should see an equal-weighted S&P 100 outperform a capitalization-weighted S&P 100. While I do not have data on the total return of an equal-weighted S&P 100 Index for 20 years, I do have fourteen years of data that show that an equal weighted index would have outperformed the capitalization-weighted index by 1.77% per year since the beginning of 2001. When I have previously discussed equal-weighting the S&P 500, some readers have commented that this is simply a mid-cap strategy, owing all of its outperformance to the size factor, but I hope this data shows that the contrarian re-balancing is also an important piece of the structural alpha gleaned through equal-weighting. Some of the most powerful ideas in finance are the easiest and simplest to implement. At its core, equal weighting overcomes the bias inherent in the capitalization-weighted benchmark index that forces investors to hold larger proportions of stocks that have risen in value. Periodic rebalancing allows the strategy to “buy low and sell high”, still the most tried and true way of making money in financial markets. Each of the five strategies I have outlined in this series share this notion that sometimes the best ideas are the simplest. I hope long-term buy-and-hold investors consider the size, value, low volatility, consistent dividend growth, and equal weighting approaches that have been demonstrated to outperform the market. Each of these factor tilts gleans their outperformance from slightly different risk factors, which should generate risk-adjusted outperformance over multiple business cycles. Low Volatility will have better performance in the down-turn, the size and value factors should generate outperformance in the recovery. I conclude this series of articles with a combined twenty plus year history of their total returns. The mix columns is an equal-weighting of the five different strategies. (You now also know that periodic rebalancing of these different strategies could enhance the alpha generated.) Over twenty-years, these strategies each produced higher absolute returns than the S&P 500 and higher average returns per unit of risk. Combining these strategies would have generated a 2.1% annualized outperformance with less than 90% of the variability of returns. A 2.1% annualized outperformance over this long time frame would have meant that investors who employed these strategies for twenty years would have had nearly a 50% higher nest egg today. (click to enlarge) With the return series side-by-side, readers should notice that Low Volatility stocks and the Dividend Aristocrats outperformed in weak equity years (2000-2002, 2008). Value stocks and small cap stocks have outperformed in the early stages of economic recoveries (2003, 2009). Understanding how these five strategies perform in different parts of the business cycle is a key towards value-accretive asset allocation. Thanks to all of my readers who contributed thoughtful comments on this series. Long-time readers may be surprised that momentum, a topic I have covered in many past articles, did not make it into my five strategies. The paired switching strategies in my momentum articles have also “beat the market”, but did so with a different source of alpha than the “buy and hold” approaches that I wished to spotlight in this series. Future work will follow-up on reader questions emanating from theses articles. Additional articles will also focus on combinations of these strategies that could well serve long-term investors. Disclaimer: My articles may contain statements and projections that are forward-looking in nature, and therefore inherently subject to numerous risks, uncertainties and assumptions. While my articles focus on generating long-term risk-adjusted returns, investment decisions necessarily involve the risk of loss of principal. Individual investor circumstances vary significantly, and information gleaned from my articles should be applied to your own unique investment situation, objectives, risk tolerance, and investment horizon. Disclosure: I am/we are long RSP, SPY. (More…) I wrote this article myself, and it expresses my own opinions. I am not receiving compensation for it (other than from Seeking Alpha). I have no business relationship with any company whose stock is mentioned in this article.