Tag Archives: setpageviewname

Beyond India: Look At These Overlooked Broad Emerging Market ETFs

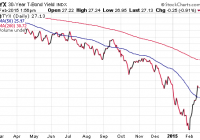
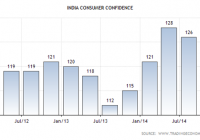
For the past one year, India has been dominating the broad emerging markets, thanks to the enormous ascent of its stock market on pro-growth political hopes, declining inflation – which was once a botheration for the economy – and the latest interest rate cut to spur growth. While its supremacy is still prevalent in the emerging market space, one might be concerned about the overvaluation issues associated with the Indian stocks and the related ETFs. Presently, the biggest and broader emerging market ETF – the Vanguard FTSE Emerging Markets ETF (NYSEARCA: VWO ) and the broader U.S. market SPDR S&P 500 Trust ETF (NYSEARCA: SPY ) sport a P/E (TTM) of 12 and 17 times, respectively, while iShares MSCI India Index ETF (BATS: INDA ) has a P/E (TTM) of 19 times. Secondly, a drastic slump in oil price played its role in facilitating the India ETFs’ upward journey. This was because the country imports more than 75% of its oil requirements. With global oil prices falling about 50% in the last six months, Indian foreign reserves found real reasons to cheer about. However, it remains to be seen how the Indian economy handles the situation when the oil price bottoms and reverses the trend. Also, some analysts believe that the not-so-enthusiastic December 2014 corporate results, a later-than-expected rebound in the investment cycle and overvaluation with respect to the future profit growth potential might stress out the Indian market. Given this situation, some cautious investors might begin to reconsider their emerging market investments and look for broader exposure, rather than sticking to any particular nation. After all, the emerging market space should continue to enjoy cheap money inflows, thanks to QE starting in the eurozone and the easy money policy in most developed nations, despite the likely beginning of policy tightening in the U.S. this year. In light of this, we have highlighted four overlooked ETFs that are tracking emerging markets from around the world (See all emerging market equities ETFs here ). Market Vectors MSCI Emerging Markets Quality ETF (NYSEARCA: QEM ) This fund has attracted $5.3 million in AUM. It charges a 50 bps fee per year, and trades in a paltry volume of around 1,500 shares a day, ensuring additional cost in the form of a wide bid/ask spread. The product tracks the MSCI Emerging Markets Quality Index, and holds 201 stocks in its basket (Read: QEM: A Higher Quality Emerging Market ETF? ). The ETF is slightly tilted toward the top four firms – China Mobile, Tencent Holdings, Taiwan Semiconductor and Samsung Electronics – that collectively make up for more than 20% of total assets. Other firms hold not more than 3.01% share, suggesting modest diversification across each security. The holding pattern reflects the fund’s focus on Asian countries like China (20.7%), India (13%), Taiwan (13.0%), South Korea (12%) and South Africa (11.1%), which take the top five country spots. In terms of sector holdings, Information Technology dominates the portfolio at 34%, followed by Consumer Staples (16.8%), Telecommunication Services (12.6%) and Financials (11.5%). The fund has gained 6.2% since the start of the year (as of February 13, 2015) and more than 8.5% in the last two weeks. The fund yields 2% annually (as of the same date). Behind its decent performance is quality exposure across a number of deserving sectors in the emerging markets and a focus on high-quality criteria like high return on equity, stable year-over-year earnings growth and low financial leverage. The fund trades at a P/E (TTM) of 15 times. iShares MSCI Emerging Markets EMEA Index ETF (NASDAQ: EEME ) This fund has amassed about $8.8 million in assets so far, and trades in volumes of 2,000 shares a day, resulting in additional cost in the form of a wide bid/ask spread over and above the expense ratio of 49 bps a year. The fund is tilted toward South Africa (46.2%), Russia (20.9%), while the third country, Turkey, gets a meager allocation of 9.64%. As far as sectoral diversification is concerned, Financials gets about 34% of the basket, followed by Energy (16.6%) and Consumer Discretionary (14.8%). The latest cease-fire between Ukraine and Russia and the record rally in the South African stocks led the fund way higher. The fund has gained 4.2% so far this year (as of February 13, 2015) and about 6.6% in the last two weeks. The fund yields 3.1% annually (as of February 13, 2015). It trades at a P/E (TTM) of 10 times. ALPS Emerging Sector Dividend Dogs ETF (NYSEARCA: EDOG ) The product tracks the S-Network Emerging Sector Dividend Dogs Index, which gives exposure to a basket of large-cap and high-yield stocks domiciled in the emerging markets. The index takes up an equal-weighted approach to assign weights to securities (Read: ALPS Debuts Dividend ETF in Emerging Market Space ). The index applies the “Dogs of the Dow” theory in the stock selection process. The product looks to hold about 50 stocks with this approach. The ETF offers a solid level of diversification, as both sector and country exposure is limited to five securities. Russia (11.2%), South Africa (10.4%), Brazil (10.3%), China (10%) and Thailand (9.65%) are some of the nations that the fund puts heavy weight on. EDOG has generated about $11.3 million in assets, and trades in 10,000 shares a day. It charges 60 bps in fees. The fund is up 6% in the YTD frame (as of February 13, 2015), while it yields 3.2%. The need for higher yield should be the key to the fund’s future success. EGShares Emerging Markets Domestic Demand ETF (NYSEARCA: EMDD ) EMDD seeks to tap the exponentially rising domestic demand of the emerging market space. The fund puts heavy weight on South Africa (20.2%), China (19.2%), Mexico (16%) and India (11.1%). It has an asset base of $35 million, and trades in volumes of more than 5,000 shares a day. The fund charges 85 bps in fees. Holding about 50 stocks in its portfolio, the fund does not put more than 5.37% assets in one stock. EMDD was up 5% so far this year, and has added about 3.5% in the last two weeks. The P/E (TTM) of the fund stands at 17 times.

U.S. Stocks And U.S. Bonds: What The Heck?

It is hard to believe just how many folks expect the U.S. stock market to rise substantially in the current environment. U.S. stocks and U.S. bonds are extremely overvalued. As long as one has a plan for exiting – rather than foolishly hoping-n-holding – one is able to minimize the risk of remaining invested in overvalued equities. Most people believe that Tom Cruise became an international superstar with the release of the action drama, “Top Gun” back in 1986. However, I remember the actor from an earlier film, “Risky Business.” The popular motion picture capitalized on teenage angst and harebrained ways to make money. In the film itself, the main character, Joel Goodson, turns his family home into a house of ill-repute to finance the repairs of his father’s Porsche – a car that he had been warned not to use, yet inadvertently destroyed. By the end of the movie, increasingly perilous behavior helped Joel get into Princeton, as opposed to him following a straighter-and-narrower path. Fans may recall the risk-taking tagline, “Sometimes you just gotta say, ‘What the Heck.'” In Hollywood, at least for the sake of on-screen comedy, irrational audacity may prove rewarding. In real life, however, investors tend to be compensated for taking reasonable risks. Granted, speculators can sometimes profit from bizarre decisions. Yet an investor who allows over-the-top exuberance to cloud sound judgment typically gets battered by panicky reversals of fortune. Indeed, it is hard to believe just how many folks expect the U.S. stock market to rise substantially in the current environment. Companies are not selling as much as they had anticipated as shown by rising manufacturer, wholesaler and retailer inventories. Companies in the S&P 500 are not profiting as much as executives had hoped either; analysts have been dramatically ratcheting down earnings expectations. Meanwhile, the parade of weak economic reports continue to flow in, from producer prices (excluding food and energy) registering an unexpected decline to smaller-than-expected gains in industrial production. Downward revisions to gross domestic product are a near certainty. What are the implications for the investing public? Sadly, it is a world where the two primary asset classes stateside – U.S. stocks and U.S. bonds – are extremely overvalued. And yet, the choices of how to manage the overvaluation in one’s portfolio are not particularly attractive either. Since there are no meaningful risk-free rates of return in a zero percent interest rate environment, investors have been choosing between risky and riskier alternatives. In one corner, expensive U.S. stocks may continue to appreciate on additional corporate buybacks as well as the possibility of economic acceleration. In the other corner, appallingly low-yielding U.S. bonds may produce total returns that exceed stocks due to the former’s relative value against developed world bonds; most of the developed world’s fixed-income yields are noticeably lower than comparable U.S. maturities. Of the two alternatives, I am still favoring long-term U.S. treasuries in client portfolios. The German 30-year bund yield is under 1%, while the Japanese 30-year is near 1.5%. As silly as those yields are, they are not likely to rise appreciably when the Bank of Japan (BOJ) and the European Central Bank (ECB) are in early stages of bond buying via quantitative easing exercises. Even more alarming? The 30-year yields for France, Canada and Italy are 1.45%, 2.12% and 2.61% respectively. We’re talking about fiscally irresponsible Italy having a lower yield than the U.S. at 2.71%. Does it not make sense to consider long-term U.S. bond exposure via the Vanguard Extended Duration Treasury ETF (NYSEARCA: EDV ) or the PIMCO 25+ Year Zero Coupon U.S. Treasury Index ETF (NYSEARCA: ZROZ ), especially when the 30-year yield has reverted back to a 50-day moving averages? Buying bond dips can be as rewarding as buying stock dips. The increasingly unattractive prospect of robust exposure to U.S. stocks has not kept me from sticking with the trends. My clients will continue to own funds like the iShares S&P 100 ETF (NYSEARCA: OEF ), the Health Care Select Sect SPDR ETF (NYSEARCA: XLV ), the Vanguard Mega Cap Growth ETF (NYSEARCA: MGK ) as well as the iShares MSCI USA Minimum Volatility ETF (NYSEARCA: USMV ) until there is a significant breach of the 200-day moving average on the downside. What-the-heck pricey? You bet. On the other hand, the market can remain insanely effervescent for a whole lot longer than an investor can accept 0% in a money market. As long as one has a plan for exiting – rather than foolishly hoping-n-holding – one is able to minimize the risk of remaining invested in overvalued equities. It is important to recognize, though, that stock uptrends in foreign markets come with lower P/E price-tags. Conservatively speaking, developed world stock assets trade at a 10%-15% P/E discount to the U.S., while broad-based emerging market stock assets may be trading at a 20% to 25% discount. It has been more difficult for me to embrace either the Vanguard FTSE Europe ETF (NYSEARCA: VGK ) or the Vanguard FTSE Emerging Markets ETF (NYSEARCA: VWO ) yet, as both have resistance at their respective 200-day trendlines and both do not have the currency-hedged exposure that I prefer at this moment. In contrast, I have advocated for several months on behalf of the iShares Currency Hedged MSCI Germany ETF (NYSEARCA: HEWG ) on the expectation that as the most successful exporter in the region, Germany will benefit the most from the battered euro. What’s more, HEWG’s uptrend is intact. Disclosure: Gary Gordon, MS, CFP is the president of Pacific Park Financial, Inc., a Registered Investment Adviser with the SEC. Gary Gordon, Pacific Park Financial, Inc, and/or its clients may hold positions in the ETFs, mutual funds, and/or any investment asset mentioned above. The commentary does not constitute individualized investment advice. The opinions offered herein are not personalized recommendations to buy, sell or hold securities. At times, issuers of exchange-traded products compensate Pacific Park Financial, Inc. or its subsidiaries for advertising at the ETF Expert web site. ETF Expert content is created independently of any advertising relationships.

The Bright Future Of The Indian Consumer

After Narendra Modi’s political party won the general election in May 2014, the Indian economy set off in a new, promising direction. Favorable demographics and foreign direct investments will be the long-term tailwinds. Tumbling inflation makes consumers more confident in spending. It is estimated that by 2030, India is likely to surpass the USA and China and become the world’s largest consumer market. Economists and investors have turned optimistic about the prospects of the Indian economy since Narendra Modi’s political party won one of the largest elections in the country’s history last May. Before Modi became a Prime Minister, he led one of the fastest growing states in the country, so many people believe his government will be able to push through the most critical reforms to liberalize local industries and revive economic growth. According to the International Monetary Fund, the reform plan of the new Prime Minister is promising, although the key is going to be implementation . In its latest World Economic Outlook, the IMF forecasts that India will grow at 6.3% this year and 6.5% in 2016, when it is likely to overtake China. In contrast to the accelerating Indian economy, the Chinese economy is still projected to struggle with its decelerating growth rate. In 2015, China’s growth rate is expected to slow to 6.8%, while a year ago it reached 7.4%. One should not forget that India is the second most populous country in the world, with over 1.27 billion people (17.5% of the world’s population), and is projected to be the world’s most populous country by 2025. What is more interesting is that more than 50% of the Indian population is below the age of 25, and it is expected that, in 2020, the average age of an Indian will be 29 years, compared to 37 for China and 48 for Japan. This population composition together with Modi’s ambitious ‘ Make in India ‘ program to attract foreign direct investments will undoubtedly support the ongoing rapid expansion of India’s middle class consumer market. A very good piece of news for the Indian economy is that the great fall in global crude oil prices, 60% in the last six months, has helped to finally tame the long-standing high inflation rate. In particular, the rising prices of food have slowed, which frees up more disposable income for India’s middle classes to spend on other goods and services. The improving optimism of Indian consumers can be evidenced by the following graph showing the recent progress of consumer confidence. (click to enlarge) According to Rachna Nath, head of retail and consumer at PwC India, consumers are still hesitant about making big luxury purchases despite the record values of the index. Consumers are positively bullish because of what the new government is doing right now, but all of them will say that we also need to see it translate on the ground. However, Indians do seem prepared to splash out on some premium fast-moving consumer goods, like foodstuffs, for example. Just a few years ago the Indian market was dominated by basic glucose biscuits. Today, higher-end varieties have grown popular. On the back of better incomes, the overall FMCG market is anticipated to expand at a CAGR of 14.7% to 110.4 billion dollars during 2012 and 2020. By that year, some reports even predict that India will become the world’s third largest middle class consumer market just behind China and the US, which it will likely surpass by the end of the next decade. Probably the best suited ETF for the trends highlighted above is the EGShares India Consumer ETF (NYSEARCA: INCO ), which is designed to track the Indxx India Consumer Index measuring the market performance of 30 Indian consumer sector companies. Since Narendra Modi assumed the office of Prime Minister in late May, the fund has added more than 34%, while two major Indian equity benchmarks, the CNX Nifty and the S&P BSE SENSEX, have gained 20 and 19% respectively. Since the beginning of this year, the fund has yet outperformed both indices by more than 6%. Moreover, most of the time, shares of the fund trade at a modest discount to NAV. Last year, there were 211 out of 252 trading days when the fund’s market price was below the reported net asset value, and this year, there have already been so far 26 such days. Presumably, the most significant INCO’s drawback lies in it’s liquidity as the fund was launched relatively recently and has a little over 52 million dollars assets under management. The picture below displays key statistics of INCO’s portfolio as of 12/31/2014. Source: EGShares India Consumer ETF’s factsheet Over the long-term, the highly inclusive sector of automobiles & parts in INCO should not only benefit from rapidly growing car and two-wheeler manufacturing industry , but also from the intended investments into infrastructure, which can be directly grasped through another ETF – the EGShares India Infrastructure ETF (NYSEARCA: INXX ). Nevertheless, one should be aware that many investors currently perceive these infrastructure projects to have unfavorable risk-reward relationships . On the other hand, it wouldn’t be a mistake to purchase the WisdomTree India Earnings ETF (NYSEARCA: EPI ), iShares MSCI India ETF (BATS: INDA ), iShares S&P India Nifty 50 Index ETF (NASDAQ: INDY ), PowerShares India Portfolio ETF (NYSEARCA: PIN ), or any other ETF, which provides exposure to the broader Indian equity market, as Modi’s reforms concern the economy as a whole. Disclosure: The author is long INCO. (More…) The author wrote this article themselves, and it expresses their own opinions. The author is not receiving compensation for it (other than from Seeking Alpha). The author has no business relationship with any company whose stock is mentioned in this article.