Tag Archives: setpageviewname

Low Volatility ETFs Turn The Lights Off And That’s A Good Thing

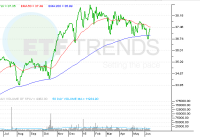
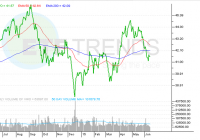
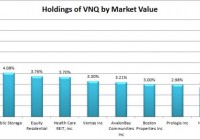
Summary Concerns about a rising rate environment has triggered a sell-off in utilities stocks. Low-volatility ETFs have trimmed their exposure to utilities. A look at the changes in low-volatility ETF options. By Todd Shriber & Tom Lydon Rising 10-year Treasury yields have, predictably, stoked chatter about the vulnerability of interest rate-sensitive asset classes and sectors. Case and point: Utilities stocks and exchange traded funds. Over the past three months, the Utilities Select Sector SPDR ETF (NYSEARCA: XLU ) , the largest utilities ETF, is off 2.2%, as 10-year Treasury yields have surged nearly 13%. There was a time when such a yield spike would have been problematic for the PowerShares S&P 500 Low Volatility Portfolio ETF (NYSEARCA: SPLV ) , particularly if investors did not properly understand how SPLV works, but that is not the case today. The low-volatility ETF targets 100 of the least volatile stocks from the S&P 500 index and weights the positions inverse to volatility – the least volatile stocks has a greater weight in the portfolio. That led to spurious accusations that SPLV was a utilities ETF in disguise. Critics will be heartened to learn that the utilities sector is now SPLV’s second-smallest sector weight. The ETF’s utilities allocation has dwindled to 2.6% as of June 12 from 19.4% in September. In fact, SPLV is underweight utilities stocks by 20 basis points relative to the S&P 500. “Given the prospect of higher rates, investors may wish to consider a low volatility investment approach and check their holdings for interest rate sensitivity. Over the past five years, financial stocks have been among the most sensitive to rising interest rates – especially insurance and diversified financial shares,” according to a recent PowerShares note. Of course, utilities are the group worst affected by rising interest rates. So, the double dose of good news for SPLV is its scant utilities weight combined with a 35.6% weight to financial services names, by far the ETF’s largest sector allocation. Digging deeper into SPLV’s financial services lineup reveals opportunity. Seventeen of the ETF’s financial services holdings are either insurance providers or regional banks, two industries that are positively correlated to rising interest rates. “In fact, since its May 2011 inception, SPLV has exhibited lower volatility than the S&P 500 Index. This is because the fund’s underlying index follows an unconstrained investment approach that allows for dynamic sector rotation,” according to PowerShares. “Due to SPLV’s unconstrained sector rotations, the fund has shed much of its exposure to the underperforming utility sector over the past two years, from just over 30% in March 2013 to under 3% currently.” SPLV’s primary rival, the iShares MSCI USA Minimum Volatility ETF (NYSEARCA: USMV ) , has a utilities weight of 7.7%, nearly triple that of the PowerShares offering. PowerShares S&P 500 Low Volatility Portfolio ETF (click to enlarge) Disclosure: The author has no positions in any stocks mentioned, and no plans to initiate any positions within the next 72 hours. (More…) The author wrote this article themselves, and it expresses their own opinions. The author is not receiving compensation for it. The author has no business relationship with any company whose stock is mentioned in this article.

Knowing What’s Inside Your International ETF

Summary MSCI is pushing off inclusion of Chinese A-shares into benchmark indices until China clears up some issues. FTSE, though, is already transitioning A-shares into global benchmarks. How the changes will affect emerging market index-based ETFs. By Todd Shriber & Tom Lydon Index providers MSCI (NYSE: MSCI ) and FTSE Russell recently made waves in the exchange traded funds universe due to their diverging treatment of China A-shares. In late May, FTSE Russell said it will transition A-shares into global benchmarks. Last week, MSCI said it is postponing the addition of A-shares to its indexes, pending China’s ability to clear up some market accessibility issues, though the index provider added if China is successful in those efforts, A-shares could be added to MSCI indexes outside of the providers’ regular classification schedule. What that means for investors in the Vanguard FTSE Emerging Markets ETF (NYSEARCA: VWO ) , the largest emerging markets ETF by assets, and the iShares MSCI Emerging Markets ETF (NYSEARCA: EEM ) is that VWO is heading toward a 5.6% A-shares allocation while EEM is in a wait-and-see mode. “Vanguard said that it recently received a $1.6 billion initial quota for China A-shares for use in its funds that the company believes will provide exposure to China’s largest issuers and a level of diversification that isn’t otherwise available in the market. Vanguard plans to apply quarterly for additional quota and increase its exposure to China A-shares as it transitions to a new FTSE index. However, with $69 billion in assets currently in Vanguard Emerging Market share classes, we think investors will need watch for how closely it can continue grow its exposure to China as planned,” said S&P Capital IQ in a recent note. EEM currently has a China allocation of about 25.1%, nearly 1,100 basis points above South Korea, the ETF’s second-largest country weight. VWO devotes 28.7% of its weight to Chinese stocks. Speaking of South Korea, Asia’s fourth-largest economy highlights another important difference between EEM and VWO. “For the past year, the biggest difference between Vanguard and iShares emerging market ETFs was the exclusion of South Korea in the Vanguard products,” said S&P Capital IQ. With the iShares MSCI South Korea Capped ETF (NYSEARCA: EWY ) up just 0.2% this year, EEM is up 2.4%, trailing the 4% gain posted by VWO. Investors don’t have to wonder what a diversified emerging markets with an appropriate A-shares allocation and no South Korea weight looks like, because the KraneShares FTSE Emerging Markets Plus ETF (BATS: KEMP ) answers that question. KEMP is the first diversified emerging markets ETF to include A-shares by way of 24.5% weight to the KraneShares Bosera MSCI China A ETF (NYSEARCA: KBA ) , the lone U.S.-listed A-shares ETF that tracks an MSCI index . KEMP has outpaced EEM and VWO this year. S&P Capital IQ has marketweight ratings on EEM and VWO. Vanguard FTSE Emerging Markets ETF (click to enlarge) Disclosure: The author has no positions in any stocks mentioned, and no plans to initiate any positions within the next 72 hours. (More…) The author wrote this article themselves, and it expresses their own opinions. The author is not receiving compensation for it. The author has no business relationship with any company whose stock is mentioned in this article.

VNQ: Take The 3.85% Yield; Duplication Is Rarely Worth It

Summary I’ve been getting questions about why investors should choose VNQ over buying largest holdings within VNQ. VNQ offers substantially better diversification than investors can create by replicating the top holdings. The ETF yield is surprisingly similar to the yields across the top holdings. If an investor is committed to a plan of dollar cost averaging, VNQ offers a smart way to minimize trading costs. Vanguard REIT Index ETF (NYSEARCA: VNQ ) offers investors strong distribution yields at a rate of 3.89%. However, some investors are contemplating if they would be better off simply buying the top 5 or 10 holdings of VNQ to avoid the expense ratio and generate more income by concentrating their investments in the REITs with the highest yields. It’s a reasonable idea and it is worth some discussion. I wanted to offer a thorough response on some of the reasons that I believe investing in VNQ is superior to trying to replicate the portfolio through buying the top ten holdings. Holdings I put together a quick chart showing the recent holdings of VNQ based on their most recent market values. (click to enlarge) The top 10 holdings make up about 37% to 38% of the value of the ETF. That is a fairly substantial portion, but not substantial enough that it would make it easy to duplicate the fund by buying the top holdings. An investor that only buys the top 10 would still be missing out on a very substantial amount of diversification from the other 62% or so of the portfolio. Dividend Yields I put together a chart showing the dividend yields on each of the top 10 positions. For the convenience of readers, I kept the holdings in the same order rather than sort them by the highest dividend yields: (click to enlarge) There are certainly a few REITs in this ETF that are paying much higher yields than the main portfolio, but investors focusing on only the highest yield REITs will be putting themselves at risk for slower growth in the pay outs or more risk to the dividend itself. Higher yields are often related to higher levels of risk, so holding only the highest yielding REITs would result in a significantly higher concentration of risk. If you were to take the average yield (equally weighted) of the top 5 REITs, you would have 4.018%. If you take the average yield across the top 10, it is 3.764%. This suggests that all around VNQ is paying a fairly similar level of dividends to what an investor would expect if they focused on buying the top 5 or top 10 holdings by market value in an equally weighted portfolio. Expense ratios are fairly low The Vanguard REIT Index ETF has an expense ratio of only .12%. That does cost shareholders money compared to simply holding all of the underlying securities, but the cost is fairly low compared to the benefits. In exchange for the .12% ratio the investors are able to buy shares in a high liquid ETF with the spread is frequently one cent. On a share price that is floating around $77, that is a very attractive bid ask spread. For comparison, at the time of my checking Simon Property Group, Inc. ( SPG) had a 4 cent bid ask spread on a price around $176 (slightly better larger than VNQ), P ublic Storage (P SA) had a spread of 4 cents on a price around $187, Equity Residential ( EQR) had a spread of 1 cent on shares running around $70 (about equal to VNQ), and Health Care REIT, Inc. ( HCN) had a spread of 2 cents on a price slightly under $70. In short, the Bid-Ask spread on even the largest equity REITs is slightly worse than the spread on VNQ. Granted, if you have an indefinite holding time period the spread is only an issue when purchasing, but it does increase the cost of buying into the position. If an investor has free trading on VNQ (some brokerages do), then their trading cost to buy into positions is limited to crossing the spread. If an investor is simply doing a buy and hold with a 40 year time frame, this isn’t a huge consideration. For the investor with a 40 year time frame that is buying their REITs in one single purchase, it makes sense to replicate the fund. For an investor with a long time frame that intends to continue investing REITs by buying into their position every month or every quarter for dollar cost averaging, it would be better to take advantage of the low spreads and look for a brokerage that is offering no commissions on VNQ. Conclusion While it would be possible to generate higher yields than VNQ by picking the equity REITs with the highest yields, it would also leave an investor facing significantly more diversifiable risk. The extra income may be nice and replicating the portfolio through buying a very large volume of the securities (you’d need more than 10) would make sense for a long term investor that does not plan to be investing new money every month or every quarter. For the investor that is planning to dollar cost average into their investments and builds them up over a period of years, the purchases will be more frequent and the investor may save more on trading commissions and spreads than they lose on the expense ratio. Whether this works or not will depend on the individual investor. My dollar cost averaging strategy puts in place a minimum amount of purchasing activity for REITs, but I will occasionally add to the position when I see share prices fall. Disclosure: The author is long VNQ. (More…) The author wrote this article themselves, and it expresses their own opinions. The author is not receiving compensation for it (other than from Seeking Alpha). The author has no business relationship with any company whose stock is mentioned in this article. Additional disclosure: Information in this article represents the opinion of the analyst. All statements are represented as opinions, rather than facts, and should not be construed as advice to buy or sell a security. Ratings of “outperform” and “underperform” reflect the analyst’s estimation of a divergence between the market value for a security and the price that would be appropriate given the potential for risks and returns relative to other securities. The analyst does not know your particular objectives for returns or constraints upon investing. All investors are encouraged to do their own research before making any investment decision. Information is regularly obtained from Yahoo Finance, Google Finance, and SEC Database. If Yahoo, Google, or the SEC database contained faulty or old information it could be incorporated into my analysis.