Tag Archives: setpageviewname

Rising Rates Are Good For PHK, Part II

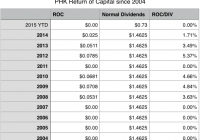
Summary PHK pays out 19.2% of its NAV in dividends to shareholders. This distribution is unsustainable, as the fund’s managers have increasingly relied on active investment in bonds, currencies, and derivatives to sustain payouts with minimal return of capital, thus increasing risk. If interest rates rise, PHK is likely to become less reliant on this riskier approach as its NII will increase. The greatest concern regarding Pimco High Income Fund (NYSE: PHK ) is its payout to NAV ratio. With NAV of $7.62 as of July 2nd and annual dividend payouts of $1.46256, the fund needs to get a 19.2% return to sustain its dividend. Bears argue that this is impossible, and that the fund has to return capital and deplete its NAV to maintain the unsustainable dividend. However, according to CEF Connect , PHK has not paid a Return of Capital in over a year. On top of that, PHK’s history of funding distributions through ROC is moderate. While 1.71% of distributions came from ROC last year, that is down from the prior two years: Also significant: the fund has not resorted to ROC to fund distributions in years of rising rates — years of ROC distributions coincide with times of heightened economic crisis (2008, 2009, 2010) for the most part, although the reliance of ROC during 2012, 2013, and 2014 indicates the fund has had some difficulty in covering distributions from income along. However, the consistent decline in ROC and the absence of ROC so far for 2015 suggests that the fund has been able to wean itself off this stop-gap. There is still a fear that the fund will need to resort to ROC soon, since the average coupon of the fund, according to its most recent holdings report , is 5.165%. Even with leverage, which has fallen to 29% in recent months, it seems there is no way the fund can return 19%. So how can PHK continue to cover dividends when it is paying out 19% on NAV? Clipping Coupons To understand this, we first need to take a step back and remind ourselves that the income a bond holder receives is not necessarily the same as the coupon rate. Bonds are frequently bought at a discount, particularly by institutional investors who have greater access to a market that is much less liquid than equities. Since PHK does not reveal the price it has paid for its holdings, and we can only infer how long it keeps certain holdings in its portfolio, coupon rates are useless in determining the sustainability of the dividend or the fund’s ability to earn a 19% return on NAV. Additionally, the fund’s use of derivatives, its arbitrage and hedging from shorting, and its currency trades make it impossible to know exactly how well operations can fund distributions to shareholders. A better way to understand the return it is getting from its portfolio is to compare its net investment income to its NAV. If we look at these, we see that the fund is now earning about a 12.4% return: This is nowhere near the 19% return that is necessary to sustain the dividend in perpetuity, but is much better than the coupon rates suggest. However, this might become the wrong way to look at this fund if rates rise sufficiently. A Better Investment on Rising Rates While it is undeniable that the low interest rate environment hurts PHK’s NII and its ability to sustain its dividend, the sustainability of those payouts improves considerably in times of higher rates, as the above chart suggests. NII has fallen 43% from 2006 to 2015 due to lower interest rates, and its NII is likely to rise if rates rise and the fund is able to purchase discounted issues with a higher coupon rate. The fund’s recent decline in leverage might indicate its managers are anticipating a rise in rates and are positioning themselves accordingly by freeing up access to capital. Much more crucially: a rise in rates will also help the fund cover dividends, as its NII-to-Dividend Ratio remained well over 100% until the Global Financial Crisis in 2008: Surprisingly, the fund’s NII-to-Dividend ratio remained strong in 2009, when its NAV plummeted to less than $3 at its lowest point. At that time, and for several years since then, the fund has been able to more than cover dividends through investment operations — the kind of arbitrage, churn, and derivative trading that investors pay for. (The significant exception, in 2012, was during Bill Gross’s tenure as manager of the fund. He is no longer with the fund or PIMCO.) The fact that the fund has relied on this kind of active speculation more than before 2008 suggests that there is considerably greater risk in the fund than there was then, but it may also suggest that the fund will become less reliant on such tactics when rates rise. While it is true that the total capital PHK has to invest is much less than in 2005-2008, making it a riskier investment than it was then, its access to higher-yielding bond opportunities in a rising rate environment may make it a less risky investment than it has been since 2008 and throughout the 7 years that the fund maintained its monthly dividend payouts. Conclusion PHK is not without its risks. Its reliance on derivatives and investment operations, particularly since 2009, means greater volatility in dividend coverage and a greater risk in a decline in NAV, as we have seen in four of the last 8 years since the Global Financial Crisis, including this year. At the same time, the fund’s ability to earn higher rates of income in periods of rising rates means that a sell-off due to rising rates is unwarranted. Most significantly, if rates do rise later this year or next year, PHK may find it easier to earn income from the high yield market and become less reliant on derivatives and active trading to boost returns. Disclosure: I am/we are long PHK. (More…) I wrote this article myself, and it expresses my own opinions. I am not receiving compensation for it (other than from Seeking Alpha). I have no business relationship with any company whose stock is mentioned in this article.

Why I’ll Be Shopping For A VIX Short This Week

Summary U.S. economics still remain positive. Historical patterns for UVXY show us that further upside risk in this environment is limited. The Greece situation is way overblown. Hello everyone, Last week we discussed why all of the people that shouted “short volatility” the second it spiked were incorrect. On the night of 7/5 futures spiked to 19 but have settled to between 17-18. There are a couple ways to play this scenario. My favorite VIX candidates are the Proshares Ultra VIX Short-Term VIX Futures ETF (NYSEARCA: UVXY ) and its sister, the Proshares Short VIX Short-Term Futures ETF (NYSEARCA: SVXY ). UVXY This ETF invests in front and second month VIX futures, which can be found on the CBOE website here . As of writing vixcentral.com continues to be down and I would use that link until it is back up. I have a library of articles on UVXY if you need additional information and reading. Below is a look at VIX futures at the close of market Thursday July 2, 2015. Markets were closed Friday. Futures were still in contango at the end of last week, however they have entered backwardation several times now. This metric is my preferred measure of when to short volatility. (click to enlarge) UVXY benefits when futures are in backwardation. For more on contango and backwardation, watch this short video . I do not expect contango to hang around for more than a week. U.S. Economics For the best view on the U.S. economy each week, I recommend Jeff Miller’s “Weighing the Week Ahead” series. Here is a link to his author page on Seeking Alpha. This is, hands down, the best free review of the previous week and summary of the week ahead. I highly recommend having Jeff as one of your followings. My view is that the economy is still improving. Our GDP has been looking like Amazons earnings lately but we may now have that permanent seasonal economy. Da Fed If you read my article on Janet Yellen then you know what Fed speak can do for the markets. We have a lot of Fed speech this week and I expect that to have an overall soothing effect. If the dollar remains stronger I believe this will delay the Feds rate hike from September. As I have previously stated, they are in no hurry to raise rates and will be carefully looking over incoming data. At the first sign of weakness I would expect them to blink. SVXY This ETF works in the opposite way UVXY does. You could look into purchasing shares but I would warn that if conditions worsen or backwardation persists, it will have negative implications. Options I will be shopping and hopefully purchasing SVXY and selling UVXY call options sometime this week. Greece I highly appreciate the Greek people providing us with this opportunity. However, as with any volatility spike people are usually suffering. I wish them the best in their recovery and I hope they are able to work out a fair and equitable solution that enables their economy and quality of life to grow. Disclaimer Although I am shorting volatility this week, it is not for everyone. I could be wrong on my assessment and lose a lot of money. If you are not ok with losing money, then you should not be trading volatility or anything else for that matter. Historically speaking this situation will resolve itself and the market has entered oversold conditions. The only other surprises I see here should be positive. If you don’t understand how UVXY and SVXY work, you should check out my library of educational resources here on Seeking Alpha before investing in either of these products. Coverage For live coverage of volatility you can follow me here on Seeking Alpha, on Twitter, or on StockTwits, just search Nathan Buehler. I recommend following me on at least one of these to prevent any editorial delays associated with publishing full articles. Disclosure: I am/we are short UVXY. (More…) I wrote this article myself, and it expresses my own opinions. I am not receiving compensation for it (other than from Seeking Alpha). I have no business relationship with any company whose stock is mentioned in this article.

The Big Picture

Summary US markets have surged in recent years. But this pattern has happened before. Foreign markets may present big opportunities. This is a shortened version of the latest Euro Pacific Capital’s Global Investor Newsletter . The past four years or so have been extremely frustrating for investors like me who have structured their portfolios around the belief that the current experiments in central bank stimulus, the anti-business drift in Washington, and America’s mediocre economy and unresolved debt issues would push down the value of the dollar, push up commodity prices, and favor assets in economies with relatively low debt levels and higher GDP growth. But since the beginning of 2011, the Dow Jones Industrial Average has rallied 67% while the rest of the world has been largely stuck in the mud. This dominance is reminiscent of the four years from the end of 1996 to the end of 2000, when the Dow rallied 54% while overseas markets languished. Although past performance is no guarantee of future results, a casual look back at how the U.S. out-performance trend played out the last time it had occurred should give investors much to think about. The late 1990s was the original “Goldilocks” era of U.S. economic history, one in which all the inputs seemed to offer investors the best of all possible worlds. The Clinton Administration and the first Republican-controlled Congress in a generation had implemented policies that lowered taxes, eased business conditions, and encouraged business investment. But, more importantly, the Federal Reserve was led by Alan Greenspan, whose efforts to orchestrate smooth sailing on Wall Street led many to dub Mr. Greenspan “The Maestro.” Towards the end of the 1990’s, Greenspan worked hard to insulate the markets from some of the more negative developments in global finance. These included the Asian Debt Crisis of 1997 and the Russian debt default of 1998. But the most telling policy move of the Greenspan Fed in the late 1990’s was its response to the rapid demise of hedge fund Long term Capital Management (LTCM), whose strategy of heavily leveraged arbitrage backfired spectacularly in 1998. Greenspan engineered a $3.6 billion bailout and forced sale of LTCM to a consortium of Wall Street firms. The intervention was an enormous relief to LTCM shareholders but, more importantly, it provided a precedent that the Fed had Wall Street’s back. Not surprisingly, the 1990s became one of the longest sustained bull markets on record. But in the latter part of the decade the markets really started to climb in an unprecedented trajectory. As the bubble began inflating in earnest Greenspan was reluctant to follow the dictum that the Fed’s job was to remove the punch bowl before the party got out of hand. Instead he argued that the Fed shouldn’t prevent bubbles from forming, but simply to clean up the mess after they burst. But while U.S. markets were taking off, the rest of the world was languishing, or worse: (click to enlarge) Created by EPC using data from Bloomberg All returns are currency-adjusted But then a very funny thing happened. In March 2000, the music stopped and the dotcom bubble finally burst, sending the Nasdaq down nearly 50% by the end of the year, and a staggering 70% by September 2001. When investors got back into the market their values had changed. They now favored low valuations, real revenue growth, understandable business models, high dividends, and low debt. They came to find those features in the non-dollar investments that they had been avoiding. Over the seven years that began at the end of 2000 and lasted until the end of 2007 the S&P 500 inched upwards by just 11%, for an average annual return of only 1.6%. But over that time frame the world index (which includes everything except the U.S.) was up 72%. The emerging markets, which had suffered the most during the four prior years, were up a staggering 273%. See table below: (click to enlarge) Created by EPC using data from Bloomberg All returns are currency-adjusted Not surprisingly, the markets and asset classes that had been decimated by the Asian debt and currency crises, delivered stunning results. South Korea, which was only up 10% in the four years prior, was up 312% from 2001-2007. Brazil, which had fallen by 4%, notched a 407% return, and Indonesia, which had fallen by 50%, skyrocketed by 745%. The period was also a great time for gold and gold stocks. The earlier four years had offered nothing but misery for investors like me who had been convinced that the Greenspan policies would undermine the dollar, shake confidence in fiat currency, and drive investors into gold. Instead, gold fell 26% (to a 20-year low), and shares of gold mining companies fell a stunning 65%. But when the gold market turned in 2001, it turned hard. From 2001 – 2007, the dollar retreated by nearly 18% (FRED, FRB St. Louis), while gold shot up by 206%, and shares of gold miners surged 512%. As it turned out, we weren’t wrong about the impact of the Fed’s easy money, just too early. 2010 – 2014 In recent years, investors who have looked to avoid the dollar and the high-debt developed economies have encountered many of the same frustrations that they encountered in the late 1990s. Foreign markets, energy, commodities and gold have gone nowhere while the dollar and U.S. markets have surged as they did in 1997-2000. (click to enlarge) Created by EPC using data from Bloomberg All returns are currency-adjusted It is said history may not repeat, but it often rhymes. If so, there may be a financial sonnet brewing. There are reasons to believe that relative returns globally will turn around now much as they did back in 2000. Perhaps even more decisively. Just as they had back in the late 1990’s, investors appear to be ignoring flashing red flags. In its Business and Finance Outlook 2015, the Organization for Economic Cooperation and Development (OECD), a body that could not be characterized as a harbinger of doom, highlighted some of the issues that should be concerning the markets. Reuters provides this summary of the report’s conclusions: Encouraged by years of central bank easing, investors are plowing too much cash into unproductive and increasingly speculative investments while shunning businesses building economic growth. There is a growing divergence between investors rushing into ever riskier assets while companies remain too risk-averse to make investments. Investors are rewarding corporate managers focused on share-buybacks, dividends, mergers and acquisitions rather than those CEOS betting on long-term investment in research and development. While these trends have been occurring around the world, they have become most pronounced in the U.S., making valuations disproportionately high relative to other markets. As we mentioned in a prior newsletter , looking at current valuations through a long term lens provides needed perspective. One of the best ways to do that is with the Cyclically-Adjusted-Price-to-Earnings (CAPE) ratio, which is also known as the Shiller Ratio (named after its developer, the Nobel prize-winning economist Robert Shiller).Using 2014 year-end CAPE ratios that average earnings over a trailing 10-year period, the global valuation imbalances become evident: (click to enlarge) As of the end of 2014, the S&P 500 had a CAPE ratio of well over 27, at least 75% higher than the MSCI World Index of around 15. (High valuations are also on evidence in Japan, where similar monetary stimulus programs are underway). On a country by country basis, the U.S. has a CAPE that is at least 40% higher than Canada, 58% higher than Germany, 68% higher than Australia, 90% higher than New Zealand, Finland and Singapore, and well over 100% higher than South Korea and Norway. Yet these markets, despite the strong domestic economic fundamentals that we feel exist, are rarely mentioned as priority investment targets by the mainstream asset management firms. In addition, U.S. stocks currently offer some of the lowest dividend yields to compensate investors for the higher valuations (see chart above). The current estimated 1.87% annual dividend yield for the S&P 500 is far below the current annual dividend yields of Australia, New Zealand, Finland and Norway. If a dramatic shock occurs as it did in 2000, will investors again turn away from high leverage and high valuations to seek more modestly valued investments? Then, as now, we believe those types of assets can more readily be found in non-dollar markets. Another similarity between then and now is the propensity to confuse an asset bubble for genuine economic growth. The dotcom craze of the 1990s painted a false picture of prosperity that was doomed to end badly once market forces corrected for the mal-investments. When that did occur, and stock prices fell sharply, the Fed responded by blowing up an even bigger bubble in real estate. When that larger bubble burst in 2008, the result was not just recession, but the largest financial crisis since the Great Depression. But once again investors have mistaken a bubble for a recovery, only this time the bubble is much larger and the “recovery” much smaller. The middling 2% GDP growth we are currently experiencing is approximately half of what we saw in the late 1990s. In reality, the Fed has prevented market forces from solving acute structural problems while producing the mother of all bubbles in stocks, bonds, and real estate. A return to monetary normalcy is impossible without pricking those bubbles. Soon the markets will be faced with the unpleasant reality that the U.S. economy may now be so addicted to monetary heroine that another round of quantitative easing will be necessary to keep the bubble from deflating. The current rally in U.S. stocks has gone on for nearly four full years without a 10% correction. Given that high asset prices are one of the pillars that support this weak economy, it is likely that the Fed will unleash another round of QE as soon as the market starts to fall in earnest. The realization that the markets are dependent on Fed life support should seal the dollar’s fate. Once the dollar turns, a process that in my opinion began in April of this year, so too should the fortunes of U.S. markets relative to foreign markets. If I am right, we may be about to embark on what could become the single most substantial period of out-performance of foreign verses domestic markets. While the party in the 1990s ended badly, the festivities currently underway may end in outright disaster. The party-goers may not just awaken with hangovers, but with missing teeth, no memories, and Mike Tyson’s tiger in their hotel room. Read the original article at Euro Pacific Capital. Disclosure: I/we have no positions in any stocks mentioned, and no plans to initiate any positions within the next 72 hours. (More…) I wrote this article myself, and it expresses my own opinions. I am not receiving compensation for it. I have no business relationship with any company whose stock is mentioned in this article.