Tag Archives: setpageviewname

Coming Energy ETF Price Changes, As Seen By Market-Makers

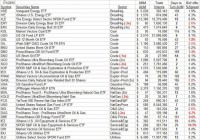
Summary Transitions in energy economics continue as extraction technology of source fuels progresses, their transportation capacity to demand sites expands, conversion technology of sources to improved use forms evolves. It can’t happen instantly, so bets made on the rate and extent of advances are being made and modified daily in the convenient, diversified forms of Exchange Traded Funds, ETFs. Energy’s pervasive presence in contemporary civilization provides a wide range of opportunities for profit gains in investment capital. The choices are so overwhelming that focus is needed. ETFs do that. Investors must be careful about their energy ETF choices since progress prospects can be quite uneven in the common denominators of time required, odds of success, and extent of payoffs. Knowledgeable investment organizations, in their attempts at best choices, cause market-makers to put their firms’ capital temporarily at risk, facilitating volume trades. Risk-aversion measures reveal the players expectations. Observers can piggy-back on knowledgeable investor expectations Energy is an enormous, complex, evolving, opportune scene. Finding reliable guides to condense and focus attention and evaluation comparisons is a daunting task. Our strategy is to let large organizations, ones that are well-resourced in experienced people who are kept currently informed by extensive information gathering systems, do the heavy lifting research of developing and maintaining comparative data. These are the buy-side movers. That flood of essential minutia leads to value judgments about likely future prices of commodities and securities prices. Uncertainty infects all expectations, making ODDS of achievement an essential component in the valuation process. Scorekeeping in the investing competition is done by rate of return, making TIME a powerful element in the equation, potentially more important than size of PAYOFFS. The buy-side movers have their own conclusions about likely specific scores and attempt to implement them by changes in investment portfolio holdings. To have significant impact on their portfolios, the changes typically are too large to be accomplished in regular-way trades of single buyer confronting single seller. These volume trade programs pursue a variety of avenues, but the most significant price-setting ones are known as block trades. Block trades are single transactions typically involving one initiator and an anonymous group of “other side of the trade” reactors organized by a market-making [MM] negotiator, where a single per-share price is achieved for all participants, with a trade spread for the MM applied against the trade initiator’s receipt or cost. Usually markets do not provide the opportunity for a “cross” where available buyers equal sellers and the MM earns an effort-free spread. Instead, to achieve a price per share acceptable to the trade initiator, the MM usually must become party to the transaction, taking a position, long or short, to balance the volume of shares between buyers and sellers. That action puts the MM firm’s capital at risk of subsequent undesired price change until the acquired position can be unwound one way or another. Actual risk-taking is not the MM’s desired activity, nor practice. Their competitive skills are in risk avoidance – hedging and arbitrage – setting up combinations of securities positions that offset unwanted price changes in at-risk capital commitments. That intellectual art form tends to dominate the markets for many derivative securities. It usually can’t be done without cost because those markets are competitive in themselves. The MM seeking protection won’t get it for free, because the sellers of the price insurance are accepting their own risk exposures in the process, and insist on being paid. What cost can be paid comes back to the judgment of the trade originator, because the hedge is part and parcel of the market liquidity being provided by the MM and gets folded into the single per share price of the block trade. A small enough cost fills the trade, too big a cost kills the trade. This is the discipline of the marketplace. Live experience of market price changes subsequent to the implied price range forecasts by MMs verifies their ongoing judgments about what may be coming for energy ETFs. What Energy ETFs are Available? Over 30 actively-traded ETFs have a focus on the energy sector, more than in any other activity of the world economy. They are very diverse in nature, ranging from fuel producers with broad product lines to the commodity prices themselves, to electric Utility converters and distributors of energy, to explorers and developers of fuel resources, to transporters and in-the-field support service organizations . Figure 1 lists these ETFs, sorted by their principal holdings focuses. It further examines the size of investor capital commitments in each, and what kind of trading activity defines the liquidity of an investor’s ability to enter or exit from the game. Transaction trade spreads give further insights into the costs of participating. Figure 1 (click to enlarge) Source: Yahoo Finance For many of the sectors of interest there are multiple ETF choices available to the investor. As usual, those attracting the largest capital commitments, Assets Under Management, or AUM, tend to have the most liquidity in terms of turnover, and lowest cost in terms of bid-offer trade spreads. Negative or inverse-acting ETFs are indicated in red, as are costly trade spreads of 2% or more. Liquidity in ETFs is a major concern because of the huge number of ETFs that have small commitments and infrequent trading at large spread costs. A few of these are indicated here, but many hundreds more are extant. Investors should take care to be able to extricate their capital in short notice when things turn unpleasant by using ETFs with quicker turnover of AUM where alternative choices are present. From this list it is clear that XLE, XLU, and AMJ have the biggest investor commitments, but that AMJ is relatively illiquid. So are the two Vanguard ETFs, VDE and VPU. USO, UCO, XOP, and OIH, despite billion-$ commitments, have good AUM turnover. But how do these ETFs compare on Risk vs. Reward? Figure 2 provides a graphic comparison of MM upside price change forecasts (reward) with prior experiences of worst-case price drawdowns (risk) during holdings of forecasts similar to today’s. It is often at such points the need for cash or the confidence in price recovery is under most stress. Figure 2 (used with permission) In this picture higher rewards and lower risks are down and to the right, with the opposite up and to the left. Equal risk and reward, in percent price change terms, are along the dotted diagonal. The most favorable combination of prospects is for the Vanguard Energy ETF (NYSEARCA: VDE ) at location [16]. The market average proxy, the SPDR S&P 500 Trust ETF (NYSEARCA: SPY ) is at [30] with the same upside prospect as VDE, but some larger drawdown exposure. Along with SPY is the First Trust Natural Gas Exploration and Production ETF (NYSEARCA: FCG ). Reaching out for higher rewards at the cost of larger risk exposure are the The United States Brent Oil ETF, LP ( BNO) [11], and the The United States 12 Month Oil ETF, LP ( USL) [10]. Big commitment ETFs, the Energy Select Sector SPDR ETF (NYSEARCA: XLE ) [20] and the iShares U.S. Energy ETF ( IYE) [3] are on the wrong side of the R~R balance just above the diagonal. Fuller details on the comparative criteria of Risk, Reward, Odds, and Payoffs for this list of ETFs is contained in Figure 3. The historical experience data shown there is from hypothetical holdings at prior dates of forecasts similar to today’s, managed under our standard TERMD T ime- E fficient R isk M anagement D iscipline. Figure 3 (click to enlarge) What is important in the table is the balance of upside prospects (5) in comparison to downside concerns (6). That ratio is expressed in the Range Index [RI] (7), whose number tells what percentage of the whole range (2) to (3) lies below the then current price (4). Today’s Range Index is used to evaluate how well prior forecasts of similar RIs for this ETF have previously worked out. The size of that historic sample is given in (12). The first items in the data line are current information: The current high and low of the forecast range, and the percent change from the market quote to the top of the range, as a sell target. The Range Index is of the current forecast. Other items of data are all derived from the history of prior forecasts. They stem from applying a T ime- E fficient R isk M anagement D iscipline to hypothetical holdings initiated by the MM forecasts. That discipline requires a next-day closing price cost position be held no longer than 63 market days (3 months) unless first encountered by a market close equal to or above the sell target. The net payoffs (9) are the cumulative average simple percent gains of all such forecast positions, including losses. Days held (10) are average market rather than calendar days held in the sample positions. Drawdown exposure indicates the typical worst-case price experience during those holding periods. Win odds (8) tells what percentage proportion of the sample recovered from the drawdowns to produce a gain. The credibil(ity) ratio (13) compares the sell target prospect (5) with the historic net payoff experiences (9). These ETFs have been ranked by (15) an odds-weighted blend of reward and risk in light of the frequency of opportunities in the sample, as a figure of merit [FOM] to include the results of prior relevant experiences. Averages of the 10 best FOM-ranked ETFs and of the set of 32 have been compiled for comparative purposes with the market proxy SPY, and with the day’s equity population average of some 2500 stocks and ETFs. Conclusion The best ten Energy ETFs as a subset offer poor comparisons to the market proxy SPY, with slightly larger upside prospects but markedly worse price drawdown experiences. Their drawdown recovery back to profitability of 79 out of 100 positions was worse than SPY’s 86 of 100. Their forecast credibility was just as poor as the market average, but with a much worse reward-to-risk ratio. Looked at as the larger set of 32, these ETFs have a pretty horrible comparison with the overall equity population. But that should not be much of a surprise, given a 50% drop in the common denominator for the entire sector, the price of crude oil. Still, there is recent hope that we may be seeing a bottom area in that price of $50-$65 per barrel. We will be producing a series of single ETF analyses on those energy ETFs where the present and coming better investment prospects may lie. Disclosure: I/we have no positions in any stocks mentioned, and no plans to initiate any positions within the next 72 hours. (More…) I wrote this article myself, and it expresses my own opinions. I am not receiving compensation for it (other than from Seeking Alpha). I have no business relationship with any company whose stock is mentioned in this article.
All That Crap About Not Panicking?

Markets were down on Monday, of course; right now the S&P 500 is at 2057, right around where it started the year. In a way, we have no idea what will happen; and in a way, we know exactly what will happen. More importantly, we know that whenever the market finishes going down, it will then go up and make a new high with the variable being how long it takes. By Roger Nusbaum, AdvisorShares ETF Strategist It is still true. As I write this post Monday after the close, there is still a lot of uncertainty on how Greece will precisely play out. Markets were down on Monday, of course; right now the S&P 500 is at 2057, right around where it started the year and is flirting with its 200 day moving average. We have seen this sort of thing many times before, and after this clears up, there will be other big scary events , a term Ken Fisher has used previously. In a way, we have no idea what will happen; and in a way, we know exactly what will happen. As I write this, again on Monday afternoon, we don’t know when the global selling in equities will end (it might already be over by the time this post is published); we don’t know whether or not China, Puerto Rico or anything else will pile on to send markets lower, even into a bear market (this is not a prediction). This could be serious or it could be one of the many big scary events that are quickly forgotten; we don’t know. We do know that the media will overreact. More importantly, we know that whenever the market finishes going down, it will then go up and make a new high, with the variable being how long it takes. The FTSE 100 recently eclipsed a high dating back to 2000; of course the NASDAQ broke its high from 2000 as well. At some point, the Nikkei will break the high from 1989, but again, no one knows when. There are different implications for different types of market participants, but they all revolve around the same things; not panicking and sticking to the strategy you thought would be a good idea when things hit the fan as they occasionally do. People in the accumulation phase need to keep accumulating. While the FTSE did just make a new high from 2000, that index has about doubled since 2009, so someone who kept accumulating should have caught most of that up move with the equity portion of their portfolio. People in the withdrawal phase should be prepared to take defensive action if that is the strategy they laid out for themselves ahead of time, or stand pat if that is the strategy they laid out for themselves ahead of time. A defensive strategy, which is what I believe in doing, offers the opportunity to make it a little easier emotionally to ride out large declines (remember, at this point we have no idea whether a large decline is coming) and standing pat (save for rebalancing) relies on remembering ahead of time that large declines will be uncomfortable, but that they end and then markets recover, with the only variable being how long it takes; repeated for emphasis. I realize none of this is new and at a high level this is something everyone knows, but knowing and doing can be two different things. Hopefully, a reminder is useful. Editor’s Note: This article discusses one or more securities that do not trade on a major U.S. exchange. Please be aware of the risks associated with these stocks. Disclosure: I/we have no positions in any stocks mentioned, and no plans to initiate any positions within the next 72 hours. (More…) I wrote this article myself, and it expresses my own opinions. I am not receiving compensation for it. I have no business relationship with any company whose stock is mentioned in this article. Additional disclosure: To the extent that this content includes references to securities, those references do not constitute an offer or solicitation to buy, sell or hold such security. AdvisorShares is a sponsor of actively managed exchange-traded funds (ETFs) and holds positions in all of its ETFs. This document should not be considered investment advice and the information contain within should not be relied upon in assessing whether or not to invest in any products mentioned. Investment in securities carries a high degree of risk which may result in investors losing all of their invested capital. Please keep in mind that a company’s past financial performance, including the performance of its share price, does not guarantee future results. To learn more about the risks with actively managed ETFs visit our website AdvisorShares.com .

Exelon Cements Credentials As A Long-Term Stock

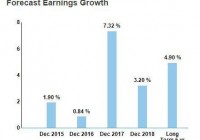
Summary Growth investments directed at improving generational assets and growing regulated asset base will ensure rate base growth and earnings stability for the company in the long run. Recent POM acquisition approval is signaling that EXC’s regulated EPS growth will improve in coming quarters. Future cash flows remain strong due to EXC’s efforts to have a large, regulated asset base. I reiterate my bullish stance on Exelon Corporation (NYSE: EXC ); the company is making good progress on its plan to have an extended regulated asset base through acquisitions and investments. EXC’s ongoing capital investments in several infrastructure development projects will add value to shareholder wealth, which will portend well for the stock price. Moreover, the company’s nuclear operation divesture plan is still under consideration; the plan, if approved, will strengthen EXC’s competitive position in the long run. The company’s rapidly growing regulated asset base provides a foundation for stable earnings and cash flow base, which will support dividend growth in future years. EXC currently offers an attractive dividend yield of 3.9%. Attractive Long-Term Growth Path Since the start of 2015, the volatile interest rate environment has weighed on utility stocks, and the utility sector underperformed the broad market in 1H’15. Owing to improving economic conditions in the U.S., the Fed is likely to increase short-term interest rates in 2H’15, which will put pressure on the stock prices of utility companies, including EXC. Despite the fear of a rise in interest rates, I believe EXC’s performance in the coming quarters will stay strong, mainly supported by the correct strategic efforts of the company. EXC, along with other utility companies in the industry, including American Electric Power (NYSE: AEP ) and PPL Corp. (NYSE: PPL ), have a robust capital spending outlook, which will support earnings growth in the next five years. EXC is following the industry norm by making hefty growth investments and acquisitions in regulated business to secure its long-term growth. During 2014, EXC spent almost $1.78 billion on several infrastructural growth-related projects, up 46.6% year-over-year. As per its recent sustainability report, the company has invested around $3.1 billion for electric and gas utility infrastructure, which includes a $500 million investment in the installation of smart meter technology during 2015. I believe the company’s recent approach to provide safe and reliable energy is bringing convenience for customers in a way that creates value for it over the long term. Another important area of investment has been EXC’s increased focus on improving its power generation capacity through the expansion and improvement of the gas business. In this regard, the company’s previously acquired 6 natural gas power plants in Maryland have started operations from June 28. The 128MW power plants will benefit EXC by improving its natural gas production capacity in the Maryland state and will ultimately add towards its rate base growth and positively affect the stock price. Moreover, the company has recently received approval for the much-awaited PEPCO Holdings (NYSE: POM ) merger from the Delaware Public Service Commission (PSC); the $6.8 billion merger is expected to complete in 2H’15, which will strengthen the company’s regulated operations and will positively affect the stock price. The upside of this merger rests in improving the EXC business and financial risk profile, as its regulated operations will increase; the company’s management expects that the merger will add nearly 15 cents-to-20 cents to EXC’s EPS during the first full year of operation. In fact, a rate base of nearly $26 billion has been projected for the combined entity, which indicates significant upside for its future ROE and cash flows. Moving ahead, under its plan of making strategic investments in diversifying the power generation portfolio, the company is planning to spend around $16 billion over the next five years, which I believe will enhance EXC’s future financial performance. On the other side, the company’s plan to shut down its loss making, Illinois-based 6 out of 11 nuclear power plants is still on hold. Recently, five of these nuclear units have failed to clear PJM’s base residual auction; despite the inability of its nuclear units to qualify for the PJM rate base auction, analysts are hoping that EXC will generate $150 million more in capacity revenue during 2017-2018 than it would have attained if all of its capacity had cleared the auction. However, the failure to qualify for the PJM auction has strengthened the company’s case before legislatures to shut down the nuclear plants. So, either the FERC should support them or LCPS standards should be changed to support its nuclear operations. While EXC is still in talks with the FERC to lower LCPS standards, I continue to believe that the closure of nuclear power plants is positively affecting the company’s performance in the long term, and will allow the company to focus more on stable regulated operations. EXC has an attractive dividend payment plan, which is strongly backed by its healthy cash flow base. Thus far, its healthy dividend payments have earned the company a decent dividend yield of 3.9% and a modest payout ratio of 48% , which indicates that there is significant room left for further dividend hikes, if the company opts to increase the payout ratio. Given EXC’s strong commitment to having a large, regulated asset base, I continue to believe in the security and sustainability of EXC’s future cash flow base, which ensures dividend stability and dividend growth in the years ahead. I recommend investors to keep track of the upcoming 2Q’15 earnings, as the company will provide an update on its capital expenditure outlook and will discuss its plans to increase regulated operations, which could have a significant impact on the stock price. According to the company’s guidance, EXC is expected to report EPS in a range of $0.45-$0.55 for Q2’15. In contrast, analysts are anticipating EPS of $0.51 for 2Q’15. The following table shows analysts; EPS forecast for EXC’s 2Q’15. Consensus EPS Forecast Low EPS Forecast High EPS Forecast 2Q’15 $0.51 $0.48 $0.55 Source: Nasdaq.com Risks The company continues to face operational and financial risk from its nuclear energy generation assets. Moreover, uncertainty about regulatory rate approvals, changes in national energy demand, stringent environmental standards and unforeseen negative economic changes are key risks that might hamper EXC’s future stock price performance. Conclusion I am bullish on EXC and believe the company will deliver a healthy performance in the long term. The company’s growth investments directed at improving its generational assets and growing its regulated asset base will ensure rate base growth and earnings stability in the long run. Furthermore, the recent POM acquisition approval is signaling that EXC’s regulated EPS growth will improve in the coming quarters. Moreover, the company’s future cash flows remain strong due to its efforts to have a large, regulated asset base, which will support dividend growth and make dividends more stable. Analysts have also projected a healthy next five-years earnings growth of 4.9% for EXC, as shown below in the chart. Source: Nasdaq.com Disclosure: I/we have no positions in any stocks mentioned, and no plans to initiate any positions within the next 72 hours. (More…) I wrote this article myself, and it expresses my own opinions. I am not receiving compensation for it (other than from Seeking Alpha). I have no business relationship with any company whose stock is mentioned in this article.