Tag Archives: send-xhr-start

2014 Portfolio Review – What Strategies Worked And Didn’t Work

2014 is officially in the books. And while I don’t like to put too much emphasis on one year of performance, it’s always helpful to look at what has worked and what hasn’t worked. After all, if you want to know where we’re going, it’s often helpful to know where we’ve been. So let’s take a look at some of the more popular portfolio constructions and see how they did in 2014: Global Financial Asset Portfolio (see construction here ) Total Return: 9.24% Standard Deviation: 5.64 Sharpe Ratio: 2.13 S&P 500 Total Return: 13.46% Standard Deviation: 11.53 Sharpe Ratio: 1.74 MSCI EAFE Total Return: -4.5% Standard Deviation: 13.22 Sharpe Ratio: 0.53 MSCI Emerging Markets Index Total Return: 0% Standard Deviation: 15.3 Sharpe Ratio: 0.75 US Long-Term Government Bonds (NYSEARCA: TLT ) Total Return: 27.31% Standard Deviation: 7.49 Sharpe Ratio: 2.93 Zero Coupon Bonds (NYSEARCA: EDV ) Total Return: 42.31% Standard Deviation: 11.19 Sharpe Ratio: 2.99 Goldman Sachs Commodity Index Total Return: -31.2% Standard Deviation: 16.32 Sharpe Ratio: -1.14 Gold Total Return: -3.75% Standard Deviation: 14.16 Sharpe Ratio: -0.32 Silver Total Return: -21.68% Standard Deviation: 25.32 Sharpe Ratio: -0.96 The big winners were US stocks and bonds while the big losers were foreign stocks and commodities. As I’ve long expected, the “high inflation is coming” trade just continued to get clobbered in 2014. The Global Financial Asset Portfolio was a strong performer in general and beat most portfolios on a risk adjusted and nominal basis. Let’s see how the so-called “passive indexing” strategies performed: US 60/40 Stock/Bond Portfolio Total Return: 10.48% Standard Deviation: 6.79 Sharpe Ratio: 2.08 Global 60/40 Stock/Bond Portfolio Total Return: 3.85% Standard Deviation: 8.15 Sharpe Ratio: 1.24 Betterment 60/40 Portfolio (see here for construction) Total Return: 6.48% Standard Deviation: 7.4 Sharpe Ratio: 1.54 WealthFront Aggressive Portfolio (see here for construction) Total Return: 4.83% Standard Deviation: 11.73 Sharpe Ratio: 1.15 Boglehead 3 Fund Portfolio Total Return: 6.91% Standard Deviation: 7.21 Sharpe Ratio: 1.58 Those are some pretty surprising numbers. Given the returns of the GFAP these are all pretty poor figures with the exception of the US focused 60/40. Not surprisingly, the Robo Advisor portfolio actually result in portfolio degradation as I suspected they would when I first analyzed them earlier this year. I still fail to understand why anyone would pay 25 bps or more for these “passively” managed Robo portfolios especially given the obviously misleading claims that their portfolios generate an “estimated additional return” of 4.6% or so. They actually led to portfolio degradation of almost 4.6% in 2014. In the case of Wealthfront’s most aggressive portfolio you actually took more risk than the S&P 500 and generated about 36% of the return. I can’t stress enough how bad that result is. The process by which many of the Robo Advisors construct their portfolios leaves much to be desired and the entire process appears to be hampered by Modern Portfolio Theory style thinking….The results speak for themselves. The other big surprise to many people will be the global 60/40. At a time when 60/40 is growing in popularity it’s likely to experience serious headwinds going forward as I explained here . 60/40 just won’t generate the types of returns going forward that it has in the last 30 years. The math is pretty simple there. Same basic story goes for the Boglehead 3 fund portfolio since it’s just a slightly altered version of what I used for the global 60/40. And as I’ve shown before , even the most prominent “passive indexers” consistently underperform the GFAP. Their asset picking approach just isn’t that sophisticated, generally results in diworsification and, unfortunately, it has been trumped up mostly by strawmanning stock picking closet indexing mutual funds. But at least it beats hedge fund investing where they charge you an arm and a leg for sub-optimal performance. What about more strategically diversified portfolios? Hedge Fund Replication HFRI Fund Weighted Composite Index (NYSEARCA: HDG ) Total Return: 2.05% Standard Deviation: 4.2 Sharpe Ratio: 1.21 Harry Browne Permanent Portfolio Total Return: 9.58% Standard Deviation: 5.31 Sharpe Ratio: 1.84 Salient Risk Parity Total Return: 13.99% Standard Deviation: 17 Sharpe Ratio: 1.70 It was a pretty mixed bag for more active approaches. Closet index funds mostly underperformed (as we should all expect) and dynamic asset allocation approaches were more mixed with some beating the GFAP and others underperforming. Hedge funds did not come close to earning their fees which, like the Robo situation, leaves me wondering why people continue to pour money into so many of those strategies. This was a pretty interesting year overall. Broadly diversified portfolios did okay if you followed the GFAP construction, but many of the most popular traditional approaches such as the Boglehead 3 fund, hedge funds and Robo Advisor portfolios significantly underperformed. If you didn’t have exposure to US assets you likely didn’t perform all that well. 2014 was a year where a more dynamic approach and some degree of specific asset picking was beneficial. Of course, if you’ve read my work on active vs. passive investing you know that all of the portfolios above are “active” to some degree. Some of them are simply constructed more intelligently than others. 2015 will be no different and the investors who construct the best dynamic “asset picking” portfolios will again generate the best returns. I still think the future of asset management is a battle over low fee dynamic asset allocation approaches. It’s the best of all worlds – low fee, diversified and dynamic asset allocation.
5 Very Successful ETF Launches Of 2014

2014 turned out to be momentous for the ETF industry with assets hitting the $2 trillion (approximately) mark. Over 180 ETFs were launched in 2014, higher than last year’s 150 initiations and 2012’s 168 rollouts. Not only this, a considerable number of ETFs are in the pipeline, pointing to growing investor interest for exchange-traded products in this market. Net inflows in November itself were $42.4 billion , indicating a record month exceeding the prior high of $41.1 billion in July 2013. Kudos go mainly to a wide range of innovative and fresh-themed products in the space, which hold investors’ attention despite the ebb and flow in the market. Among the new products, active funds, smart-beta ETFs, high yield options and hedged international products were appreciated by investors. Below, we have highlighted five ETFs launched in 2014 that scooped up assets within a short time span on the market, and look to be big winners for their issuers down the road: First Trust Dorsey Wright Focus 5 ETF (NASDAQ: FV ) The product saw huge success, though it kicked off in the initial phase of the year, earning as much as $1.7 billion in assets. First Trust has always been famous for its ‘smart indexing’. The product is designed to indentify the five First Trust sector- and industry-based ETFs that are arguably expected to have the maximum chance of outperforming the other ETFs in the selection universe. The new portfolio is based on momentum strategies as measured by Dorsey Wright’s definition of relative strength characteristics. DWA essentially eliminates the underlying ETF’s volume, intraday net asset value (NAV) or bid/ask spread and closely monitors how their prices are performing versus other ETFs within their respective universe. The following are the sector ETFs featuring in FV: First Trust NYSE Arca Biotechnology Index Fund (NYSEARCA: FBT ), First Trust Health Care AlphaDEX Fund (NYSEARCA: FXH ), First Trust Consumer Staples AlphaDEX Fund (NYSEARCA: FXG ), First Trust Dow Jones Internet Index Fund (NYSEARCA: FDN ) and First Trust Consumer Discretionary AlphaDEX Fund (NYSEARCA: FXD ). While the top choice receives about 25% exposure, the last pick gets 17.7% focus of the fund. For this ‘smart’ approach, the product charges 95 bps in fees. The product is up about 12% since its inception in early March. First Trust Enhanced Short Maturity ETF (NASDAQ: FTSM ) The actively managed product seeks to provide current income, with a focus on capital preservation. For this purpose, the fund invests in U.S. dollar denominated short-term investment grade securities. Making its debut in August, the product has already amassed as much as $798 million in assets. As such, the fund has a weighted average maturity of 0.90 years and an average duration of 0.20 years, indicating negligible interest rate risk. The fund holds a big basket of 162 securities. The fund charges 25 bps in fees and the product has been flat this year thanks to the upheaval in the short-end of the yield curve, and the fact that this space generally makes small moves anyway. Vident Core U.S. Bond Strategy ETF (NASDAQ: VBND ) The bond ETF space is tossing around the potential rate hike talks in the U.S. market. This has left investors busy in thinking through what sort of duration and investment grade bonds to pick right now. Thanks to this backdrop, VBND too has been able to garner considerable assets of $313 million within just two months. Securities with 5-7 years of maturity, with 7-10 years of maturity and with 3-5 years of maturity take about 35%, 34% and 26% of weight, respectively, in the ETF indicating the fund’s tilt toward medium-to-long-term bond market. The product charges 45 bps in fees and has lost about 0.6% since its inception. First Trust Eurozone AlphaDex ETF (NASDAQ: FEUZ ) The product hit the market on October 21 and has amassed about $323 million since then. The product looks to pick the Euro zone stocks with both growth and value factors being taken into consideration. The product is highly diversified with no stock accounting for more than 1.39% of the portfolio. The ETF has been heavy on France (23.1%) and Germany (22.6%). Investors are basically mulling over the accommodative monetary policy of the ECB and counting on the likely QE measures to be introduced in the region soon. This has helped the fund see success in such a short time frame. The product charges 80 bps in fees. iShares MSCI ACWI Low Carbon Target ETF (NYSEARCA: CRBN ) Investors would be surprised to know that the ETF industry has received two carbon funds lately. While both have been all the rage, the newer one – CRBN – has piled up $140 million in assets within just 15 days of its launch. The fund has global coverage with reduced carbon exposure. The index the fund tracks looks to pick stocks with low carbon emissions. The fund charges 20 bps in fees a year from investors.

EELV Makes The Cut For Consideration, May Be A Good Option For Emerging Market Exposure

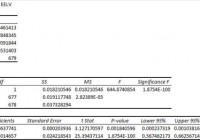
Summary I’m taking a look at EELV as a candidate for inclusion in my ETF portfolio. The expense ratio is a little high relative to my cheap tastes, but certainly within reason. The correlation to SPY is low and based on reasonable trade volumes. Returns since inception have been fairly weak, but the measuring period is less than 3 years. The ETF might fit for my portfolio. I’m not assessing any tax impacts. Investors should check their own situation for tax exposure. Investors should be seeking to improve their risk adjusted returns. I’m a big fan of using ETFs to achieve the risk adjusted returns relative to the portfolios that a normal investor can generate for themselves after trading costs. I’m working on building a new portfolio and I’m going to be analyzing several of the ETFs that I am considering for my personal portfolio. One of the funds that I’m considering is the PowerShares S&P Emerging Markets Low Volatility Portfolio (NYSEARCA: EELV ). I’ll be performing a substantial portion of my analysis along the lines of modern portfolio theory, so my goal is to find ways to minimize costs while achieving diversification to reduce my risk level. What does EELV do? EELV attempts to track the total return (before fees and expenses) of the S&P BMI Emerging Markets Low Volatility Index. At least 90% of the assets are invested in funds included in this index. EELV falls under the category of “Diversified Emerging Markets”. Does EELV provide diversification benefits to a portfolio? Each investor may hold a different portfolio, but I use SPY as the basis for my analysis. I believe SPY, or another large cap U.S. fund with similar properties, represents the reasonable first step for many investors designing an ETF portfolio. Therefore, I start my diversification analysis by seeing how it works with SPY. I start with an ANOVA table: (click to enlarge) The correlation is excellent at 70%. I want to see low correlations on my international investments. Extremely low levels of correlation are wonderful for establishing a more stable portfolio. I consider anything under 50% to be extremely low. However, for equity securities an extremely low correlation is frequently only found when there are substantial issues with trading volumes that may distort the statistics. Standard deviation of daily returns (dividend adjusted, measured since April 2012) The standard deviation is a bit high. For EELV it is .8427%. For SPY, it is 0.7420% for the same period. SPY usually beats other ETFs in this regard, so I’m not too concerned about this. Because the ETF has fairly low correlation for equity investments and an acceptable standard deviation of returns, it should do fairly well under modern portfolio theory. Liquidity looks fine Average trading volume isn’t very high, just shy of 60,000, but that isn’t low enough to be a major concern for me. Mixing it with SPY I also run comparisons on the standard deviation of daily returns for the portfolio assuming that the portfolio is combined with the S&P 500. For research, I assume daily rebalancing because it dramatically simplifies the math. With a 50/50 weighting in a portfolio holding only SPY and EELV, the standard deviation of daily returns across the entire portfolio is 0.7304%. With 80% in SPY and 20% in EELV, the standard deviation of the portfolio would have been .7215%. If an investor wanted to use EELV as a supplement to their portfolio, the standard deviation across the portfolio with 95% in SPY and 5% in EELV would have been .7349%. I know it may seem weird that the standard deviation is lowest at the middle level of including EELV, but that is normal for an asset with low correlation but higher standard deviation. Why I use standard deviation of daily returns I don’t believe historical returns have predictive power for future returns, but I do believe historical values for standard deviations of returns relative to other ETFs have some predictive power on future risks and correlations. Yield & Taxes The distribution yield is 2.68%. That appears to be a respectable yield. This ETF could be worth considering for retiring investors. I like to see strong yields for retiring portfolios because I don’t want to touch the principal. By investing in ETFs I’m removing some of the human emotions, such as panic. Higher yields imply lower growth rates (without reinvestment) over the long term, but that is an acceptable trade off in my opinion. I’m not a CPA or CFP, so I’m not assessing any tax impacts. Expense Ratio The ETF is posting .45% for a gross expense ratio, and .29% for a net expense ratio. I want diversification, I want stability, and I don’t want to pay for them. The expense ratio on this fund is higher than I want to pay for equity securities, but not high enough to make me eliminate it from consideration. I view expense ratios as a very important part of the long-term return picture because I want to hold the ETF for a time period measured in decades. Market to NAV The ETF is at a -.47% discount to NAV currently. Premiums or discounts to NAV can change very quickly so investors should check prior to putting in an order. The ETF is large enough and liquid enough that I would expect the ETF to stay fairly close to NAV. Generally, I don’t trust deviations from NAV. If I can buy an ETF at a discount to NAV, I consider that to be a favorable entry price. Largest Holdings The diversification is very good in this ETF. If I’m going to be stuck with that expense ratio, I expect it to buy a fairly strong level of diversification. This ETF is providing a good level of diversification to give some justification to the expense ratio. (click to enlarge) Conclusion I’m currently screening a large volume of ETFs for my own portfolio. The portfolio I’m building is through Schwab, so I’m able to trade EELV with no commissions. I have a strong preference for researching ETFs that are free to trade in my account, so most of my research will be on ETFs that fall under the “ETF OneSource” program. The correlation and diversification are great. The discount to NAV is also very appealing, but those discounts can disappear quickly. The net expense ratio isn’t too bad, though the gross expense ratio is less attractive. I might dig into the difference if I was considering a large position to determine how sustainable it would be. Since the ETF is covering emerging markets, I wouldn’t want to go more than 10% into the ETF because of the risks that I believe are present there. On the other hand, we saw that the portfolio had a lower standard deviation when this ETF was 20% of the portfolio rather than 5% because of the low correlation. I’ll need to test EELV in hypothetical portfolios that are more diversified to see how it does there. I think this one is worth considering for the 5% to 10% exposure to emerging markets. Additional disclosure: Information in this article represents the opinion of the analyst. All statements are represented as opinions, rather than facts, and should not be construed as advice to buy or sell a security. Ratings of “outperform” and “underperform” reflect the analyst’s estimation of a divergence between the market value for a security and the price that would be appropriate given the potential for risks and returns relative to other securities. The analyst does not know your particular objectives for returns or constraints upon investing. All investors are encouraged to do their own research before making any investment decision. Information is regularly obtained from Yahoo Finance, Google Finance, and SEC Database. If Yahoo, Google, or the SEC database contained faulty or old information it could be incorporated into my analysis. The analyst holds a diversified portfolio including mutual funds or index funds which may include a small long exposure to the stock.