Tag Archives: send-xhr-start

Best And Worst Performing Currency ETFs Of 2014

Currency markets had an eventful 2014 with the U.S. dollar touching multi-year highs against a basket of major currencies. Improving U.S. economic data, escalating geopolitical tensions, diverging central bank policies around the world and chances of a sooner-than-expected rate tightening cycle in the U.S. were some of the factors contributing to a stronger greenback. In fact, divergence in monetary policies across the globe was one of the primary factors for the strong advance in dollar this year against major currencies. While the Fed has wrapped up its QE program and is expected to start raising rates sometime this year, central banks of some of the major developed nations have stepped up their monetary stimulus programs to stimulate their struggling economies. Stronger U.S. recovery and speculations of a faster-than-expected rate hike are leading investors to pull out capital from emerging markets and pour it into U.S. stocks, causing the currencies of these nations to take a plunge. Given this, we have highlighted two of the best performing and worst performing currency ETFs of 2014 below. These were big movers in the currency market, and undoubtedly investors are expecting big things out of these currencies in 2015 as well: Best Currency ETFs of 2014 Market Vectors Indian Rupee/USD ETN (NYSEARCA: INR ) Indian equity markets have posted stellar performances this year driven by optimism over the new pro-reform, business-friendly government led by Prime Minister Narendra Modi. In fact, the Indian economy has been witnessing improving macroeconomic conditions led by better-than-expected corporate earnings, a falling inflation level and improving manufacturing and industrial production. Moreover, steps taken by the RBI governor have been successful in narrowing the current account deficit. These factors led the Indian rupee to be the best performing major currency worldwide against the dollar during 2014 and INR to be the best currency ETF this year. The fund tracks the performance of the S&P Indian Rupee Total Return Index, providing exposure to exchange rate movement of the U.S. Dollar against the Indian Rupee. The product is, however, quite unpopular and illiquid with an asset base of under $2 million and average trading volume of 27,000 shares a day. The fund charges 55 basis points as fees and has returned 14% this year. INR currently has a Zacks ETF Rank #3 or Hold rating. PowerShares DB USD Bull ETF (NYSEARCA: UUP ) Thanks to a stronger U.S. economic recovery led by higher-than-expected U.S. GDP growth numbers, renewed optimism in housing activity, continued job creation and rising consumer confidence combined with global factors, the U.S. dollar emerged as a strong currency this year. The fund tracks the performance of the Deutsche Bank Long US Dollar Index (USDX) Futures Index to provide exposure to the performance of U.S. Dollar against the following currencies: Euro, Japanese Yen, British Pound, Canadian Dollar, Swedish Krona and Swiss Franc. In terms of holdings, UUP allocates nearly 58% in Euro, while 25% collectively in Japanese Yen and British Pound. The fund has so far managed an asset base of $959.9 million and sees an average daily volume of 1.8 million shares. It charges 80 bps in total fees and expenses. The fund has added 11.3% in 2014 and has a Zacks ETF Rank of 2 or ‘Buy’ rating with Medium risk outlook. Worst Currency ETFs of 2014 CurrencyShares Swedish Krona Trust ETF (NYSEARCA: FXS ) The Swedish Krona has been among the worst performing currencies in 2014 against the greenback, with FXS plunging 18% this year. This is especially true as the currency is struggling badly in the wake of record low interest rates and deflationary pressures. The central bank’s unexpected move to slash interest rates to zero in October in order to fight deflation further aggravated the situation and led the currency to struggle badly against the U.S. Dollar. The fund tracks the price of the Swedish Krona relative to the U.S. Dollar managing an asset base of $25.3 million. The fund is quite illiquid with average daily volume of just 2,000 shares. The fund charges 40 basis points as fees and currently has a Zacks ETF Rank #3 or Hold rating. CurrencyShares Japanese Yen Trust ETF (NYSEARCA: FXY ) Though the Yen was performing well in the first part of the year due to its safe haven appeal in the wake of rising geopolitical tensions, it plummeted to a seven-year low in the second half due to an ultra loose monetary policy adopted by the Bank of Japan (BoJ). Weakening growth conditions and sliding consumer prices led the BoJ to expand its monetary policy in 2014 leading to a slumping Yen. FXY measures the relative values of two currencies, the Japanese Yen against the U.S. Dollar. The fund gains in value as the Yen appreciates relative to the Dollar. The fund manages an asset base of $105 million, charges 40 basis points as fees and trades with good volumes of 200,000 shares a day. FXY plunged roughly 13.7% for 2014, continuing its long term track record of weakness and pushing its two year loss to -27%.
Proof Positive That U.S. Stock ETFs Are Not The Only Place To Be

Financial professionals are blaming the latest round of risk asset uncertainty on a variety of factors, from the continuing sell-off in oil to the possibility of Greece being kicked out of the euro-zone. Still others are pointing to anxiety over the U.S. Federal Reserve’s intention to raise its overnight lending rate target in mid-2015 – the first move of its kind since December of 2008. Meanwhile, the biggest names in bonds have added fuel to the fire. Bill Gross at Janus has declared that the good times are over; he anticipates a plethora of “minus signs” in front of riskier asset classes by year-end. Similarly, Jeff Gundlach of DoubleLine believes the U.S. 10-year yield will test 1.38% from its 2.0% level. That is in sharp contrast to the unanimous verdict of economists that the 10-year would be sharply higher; the average expectation is 3.0% by December. Since the beginning of last year, I have argued the exact opposite and extolled the virtues of owning long-maturity treasuries via the Vanguard Extended Duration ETF (NYSEARCA: EDV ) and/or the Vanguard Long Term Government Bond Index ETF (NASDAQ: VGLT ). The yields on these safer havens have been more favorable than the sovereign debt of beleaguered foreign governments in the developed world. Even today, a 10-year U.S. Treasury at 2.0% compares quite favorably with German bunds (0.5%) and Japanese government bonds (0.3%). A wide variety of international and emerging market stock assets floundered in 2014, and they have continued to descend in the New Year. Yet it may come as a shock to some buy-the-dip enthusiasts that many U.S. stock ETFs have already broken below key support levels. The ones that I have identified in the chart below are currently below 200-day long-term trendlines (exponential). Paradise Lost? U.S. Stock ETFs Begin Falling Below Respective Trendlines % Below 200 Day SPDR Select Energy (NYSEARCA: XLE ) -17.1% Vanguard Materials (NYSEARCA: VAW ) -3.1% SPDR KBW Bank (NYSEARCA: KBE ) -2.0% Market Vectors Morningstar Wide Moat (NYSEARCA: MOAT ) -1.8% Guggenheim S&P 500 Pure Value (NYSEARCA: RPV ) -1.2% WisdomTree Small Cap Earnings (NYSEARCA: EES ) -0.9% RBS U.S. Midcap Trendpilot ETN (NYSEARCA: TRNM ) -0.9% Fidelity Telecom (NYSEARCA: FCOM ) -0.4% RBS U.S. NASDAQ 100 Trendpilot ETN (NYSEARCA: TNDQ ) -0.2% First Trust Internet (NYSEARCA: FDN ) -0.1% While nobody can predict whether the current flight from risk will be yet another head fake – investors have snapped up U.S. stock shares on every 4%-8% pullback since the winter of 2011 – extreme movements in both commodities and currencies in recent months do not bode well for the bulls. For example, dramatic falls in the price of crude oil historically correlate with an increase in geopolitical and economic crises. Does anyone believe that Wall Street can continue to ignore an uptick in overseas strife at the same time that the energy sector is reeling stateside? Similarly, the swift appreciation of the U.S. dollar and the quick depreciation of other world currencies over the last six months is likely to reduce the desire for carry trade activity and/or increase the desire to take some “chips off the table.” In other words, assets like the PowerShares DB USD Bullish ETF (NYSEARCA: UUP ) can be safe havens from stock turbulence, yet the ripple effects can create a desire for a reduction in risk taking across the board and an increase in desire for U.S. Treasury bonds. As an advocate for long-duration treasuries since the first week of January 2014 – as one who wrote at great length about the virtues of a barbell approach in a late-stage stock bull – I decided to investigate the unusually high positive correlation of two of my largest holdings, EDV and the Vanguard Dividend Appreciation ETF (NYSEARCA: VIG ). Historically speaking, treasuries and stocks have a slight positive correlation in good times and a strong negative correlation in bad times. That’s why 2014 represented an unlikely scenario where matching “risk-off” capital preservation with “risk-on” capital appreciation produced risk-adjusted gains that far exceeded stocks alone. Although CNBC would rather talk about the remarkable run in U.S. equities, there has been an unwillingness to address the extraordinary success of “risk-off” assets like EDV. On the contrary. The unanimous expectation for 55 of the leading economists in the country had been for the 3.0% 10-year yield to climb in 2014, with an average projection of 3.4%. It fell to 2.2.% The unanimous decision this time around is for the 10-year to rise from 2.2% to 3.0% in 2015. Alas, it is falling yet again here in the New Year. Granted, I may not be the only contrarian on middle-of-the-yield-curve rates, but I do not run a bond fund and I have plenty of stock exposure. I just know when and how to employ multi-asset stock hedging. Until we see a genuine bear scare, I do not expect tremendous coverage of the index that I helped to create with FTSE-Russell, the FTSE Custom Multi-Asset Stock Hedge Index . I affectionately refer to it as the “MASH” Index. Yet it should be noted that there are a variety of currencies, commodities, foreign bonds and U.S. bonds that have a history of exceptionally low correlations with U.S. stocks. What’s more, low correlations do not mean poor performance when stocks are soaring and great performance when stocks are struggling. It simply means that the assets move independently. That said, month-over-month, the FTSE Custom Multi-Asset Stock Hedge Index (a.k.a. “MASH”) is up 2.5% whereas the Dow logged -2.6%. Year-over-year? MASH gained 6.8% while the Dow picked up 6.3%. Granted, the last month demonstrates that multi-asset stock hedging works particularly well when stocks struggle, but it is hardly a prerequisite. The year-over-year results show that the index can garner admirable gains – better the t-bills or money markets – even in a stock uptrend. An investor can not invest in the FTSE Custom Multi-Asset Stock Hedge Index (MASH) directly yet, though an exchange-traded note is likely to appear in 2015. Do-it-yourself enthusiasts may acquire index components such as zero coupon bonds via the PIMCO 25+ Year Zero Coupon U.S. Treasury Index ETF (NYSEARCA: ZROZ ), the iShares National AMT-Free Muni Bond ETF (NYSEARCA: MUB ) as well longer-dated Treasuries in the iShares 10-20 Year Treasury Bond ETF (NYSEARCA: TLH ). Currencies like the dollar and the franc can be acquired in the CurrencyShares Swiss Franc Trust ETF (NYSEARCA: FXF ) and UUP. The index also includes gold via the SPDR Gold Trust ETF (NYSEARCA: GLD ). Disclosure: Gary Gordon, MS, CFP is the president of Pacific Park Financial, Inc., a Registered Investment Adviser with the SEC. Gary Gordon, Pacific Park Financial, Inc, and/or its clients may hold positions in the ETFs, mutual funds, and/or any investment asset mentioned above. The commentary does not constitute individualized investment advice. The opinions offered herein are not personalized recommendations to buy, sell or hold securities. At times, issuers of exchange-traded products compensate Pacific Park Financial, Inc. or its subsidiaries for advertising at the ETF Expert web site. ETF Expert content is created independently of any advertising relationships. Editor’s Note: This article discusses one or more securities that do not trade on a major exchange. Please be aware of the risks associated with these stocks.

Is Rising Stock Market Volatility Bullish?

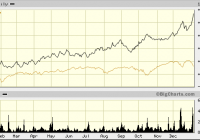
By Ronald Delegge When stocks go up, volatility goes down and vice versa. While this historically inverse relationship plays out most of the time, there’s been a significant disconnect as of late. The chart below illustrates this disconnect. As you can see, over the past three months, the S&P 500 (black line) has gained around 2.7% yet the S&P 500 volatility (ChicagoOptions:^VIX) (dotted line) has surged almost 37%. Shouldn’t the VIX be declining when stocks (NYSEARCA: IVV ) are rising? What’s going on? (Audio) Portfolio Report Card: Ron DeLegge Grades a $1.5 Million Portfolio… Pass or Fail? (click to enlarge) On Dec. 17, 2014 via our Weekly ETF Picks we alerted readers about this volatility trend by writing: “Although the S&P 500 volatility index (VIX) has fallen over the past few days, the VIX has been on a tear, gaining almost 40% since early December. Here’s what’s particularly notable about that move: the S&P 500 (SNP:^GSPC) was down only -1.26% over that same time frame! If VIX can soar almost +40% on a -1.25% loss, what type of potential does it have for a sharper pullback? We’re buying the ProShares VIX Short-term Futures ETF (NYSEARCA: VIXY ) and our tandem options trade (for investors that want more leverage) is to buy VIX call options (strike price and monthly expiration reserved for subscribers).” How has it worked out? Thus far, we’ve already bagged a nearly 35% gain on our VIX call options trade and our VIXY trade is ahead by almost 10% since we initiated our trade alert. Bottom line: We interpret the three-month trend of higher stock prices coupled with higher volatility as extremely bullish for long VIX trades. Original Post Disclosure: None Now that you’ve read this, are you Bullish or Bearish on ? Bullish Bearish Sentiment on ( ) Thanks for sharing your thoughts. Why are you ? Submit & View Results Skip to results » Share this article with a colleague