Tag Archives: nasdaqvglt

Tactical Asset Allocation – August 2015 Update

Here are the tactical asset allocation updates for August 2015. All portfolio updates are online as part of Paul’s GTAA 13 Portfolio New sheet. First, for the basic portfolios – the GTAA5 and the Permanent Portfolio. There was one change in the GTAA5 portfolio. Bonds (NYSEARCA: IEF ) went back to invested this month. GTAA5 is now 60% invested and 40% cash. For the timing version of the Permanent Portfolio there were no changes this month. The TAA version of the Permanent Portfolio is 50% invested and 50% in cash just like last month. Now for the more aggressive GTAA AGG3 and AGG6 portfolios. There are no changes for either AGG3 or AGG6 this month. Notice that the Vanguard REIT Index ETF (NYSEARCA: VNQ ) replaced the Vanguard Intermediate-Term Government Bond Index ETF (NASDAQ: VGIT ) in the top 6 ETFs, but since VNQ is under its 200-day it is not an investable position thus there are no changes from last month for AGG6. AGG6 has only 5 positions like the last 2 months with the rest of the portfolio in cash. Performance for the portfolios so far this year is in the table below. Numbers are for each month. The figures are estimates taken from a variety of sources. I don’t do detailed performance tracking until the end of the year. If you’re a fan of the Antonacci dual momentum GEM and GBM portfolios, GEM continues to be invested in US stocks (NYSEARCA: VTI ), and the bond momentum option of the GBM portfolio continues to be invested in US long-term government bonds (NASDAQ: VGLT ). No changes from last month. I’ve also made my Antonacci tracking sheet shareable so you can see the portfolio details for yourself. That’s it for this month. These portfolios signals are valid for the whole month of August. As always, post any questions you have in the comments. Share this article with a colleague

Proof Positive That U.S. Stock ETFs Are Not The Only Place To Be

Financial professionals are blaming the latest round of risk asset uncertainty on a variety of factors, from the continuing sell-off in oil to the possibility of Greece being kicked out of the euro-zone. Still others are pointing to anxiety over the U.S. Federal Reserve’s intention to raise its overnight lending rate target in mid-2015 – the first move of its kind since December of 2008. Meanwhile, the biggest names in bonds have added fuel to the fire. Bill Gross at Janus has declared that the good times are over; he anticipates a plethora of “minus signs” in front of riskier asset classes by year-end. Similarly, Jeff Gundlach of DoubleLine believes the U.S. 10-year yield will test 1.38% from its 2.0% level. That is in sharp contrast to the unanimous verdict of economists that the 10-year would be sharply higher; the average expectation is 3.0% by December. Since the beginning of last year, I have argued the exact opposite and extolled the virtues of owning long-maturity treasuries via the Vanguard Extended Duration ETF (NYSEARCA: EDV ) and/or the Vanguard Long Term Government Bond Index ETF (NASDAQ: VGLT ). The yields on these safer havens have been more favorable than the sovereign debt of beleaguered foreign governments in the developed world. Even today, a 10-year U.S. Treasury at 2.0% compares quite favorably with German bunds (0.5%) and Japanese government bonds (0.3%). A wide variety of international and emerging market stock assets floundered in 2014, and they have continued to descend in the New Year. Yet it may come as a shock to some buy-the-dip enthusiasts that many U.S. stock ETFs have already broken below key support levels. The ones that I have identified in the chart below are currently below 200-day long-term trendlines (exponential). Paradise Lost? U.S. Stock ETFs Begin Falling Below Respective Trendlines % Below 200 Day SPDR Select Energy (NYSEARCA: XLE ) -17.1% Vanguard Materials (NYSEARCA: VAW ) -3.1% SPDR KBW Bank (NYSEARCA: KBE ) -2.0% Market Vectors Morningstar Wide Moat (NYSEARCA: MOAT ) -1.8% Guggenheim S&P 500 Pure Value (NYSEARCA: RPV ) -1.2% WisdomTree Small Cap Earnings (NYSEARCA: EES ) -0.9% RBS U.S. Midcap Trendpilot ETN (NYSEARCA: TRNM ) -0.9% Fidelity Telecom (NYSEARCA: FCOM ) -0.4% RBS U.S. NASDAQ 100 Trendpilot ETN (NYSEARCA: TNDQ ) -0.2% First Trust Internet (NYSEARCA: FDN ) -0.1% While nobody can predict whether the current flight from risk will be yet another head fake – investors have snapped up U.S. stock shares on every 4%-8% pullback since the winter of 2011 – extreme movements in both commodities and currencies in recent months do not bode well for the bulls. For example, dramatic falls in the price of crude oil historically correlate with an increase in geopolitical and economic crises. Does anyone believe that Wall Street can continue to ignore an uptick in overseas strife at the same time that the energy sector is reeling stateside? Similarly, the swift appreciation of the U.S. dollar and the quick depreciation of other world currencies over the last six months is likely to reduce the desire for carry trade activity and/or increase the desire to take some “chips off the table.” In other words, assets like the PowerShares DB USD Bullish ETF (NYSEARCA: UUP ) can be safe havens from stock turbulence, yet the ripple effects can create a desire for a reduction in risk taking across the board and an increase in desire for U.S. Treasury bonds. As an advocate for long-duration treasuries since the first week of January 2014 – as one who wrote at great length about the virtues of a barbell approach in a late-stage stock bull – I decided to investigate the unusually high positive correlation of two of my largest holdings, EDV and the Vanguard Dividend Appreciation ETF (NYSEARCA: VIG ). Historically speaking, treasuries and stocks have a slight positive correlation in good times and a strong negative correlation in bad times. That’s why 2014 represented an unlikely scenario where matching “risk-off” capital preservation with “risk-on” capital appreciation produced risk-adjusted gains that far exceeded stocks alone. Although CNBC would rather talk about the remarkable run in U.S. equities, there has been an unwillingness to address the extraordinary success of “risk-off” assets like EDV. On the contrary. The unanimous expectation for 55 of the leading economists in the country had been for the 3.0% 10-year yield to climb in 2014, with an average projection of 3.4%. It fell to 2.2.% The unanimous decision this time around is for the 10-year to rise from 2.2% to 3.0% in 2015. Alas, it is falling yet again here in the New Year. Granted, I may not be the only contrarian on middle-of-the-yield-curve rates, but I do not run a bond fund and I have plenty of stock exposure. I just know when and how to employ multi-asset stock hedging. Until we see a genuine bear scare, I do not expect tremendous coverage of the index that I helped to create with FTSE-Russell, the FTSE Custom Multi-Asset Stock Hedge Index . I affectionately refer to it as the “MASH” Index. Yet it should be noted that there are a variety of currencies, commodities, foreign bonds and U.S. bonds that have a history of exceptionally low correlations with U.S. stocks. What’s more, low correlations do not mean poor performance when stocks are soaring and great performance when stocks are struggling. It simply means that the assets move independently. That said, month-over-month, the FTSE Custom Multi-Asset Stock Hedge Index (a.k.a. “MASH”) is up 2.5% whereas the Dow logged -2.6%. Year-over-year? MASH gained 6.8% while the Dow picked up 6.3%. Granted, the last month demonstrates that multi-asset stock hedging works particularly well when stocks struggle, but it is hardly a prerequisite. The year-over-year results show that the index can garner admirable gains – better the t-bills or money markets – even in a stock uptrend. An investor can not invest in the FTSE Custom Multi-Asset Stock Hedge Index (MASH) directly yet, though an exchange-traded note is likely to appear in 2015. Do-it-yourself enthusiasts may acquire index components such as zero coupon bonds via the PIMCO 25+ Year Zero Coupon U.S. Treasury Index ETF (NYSEARCA: ZROZ ), the iShares National AMT-Free Muni Bond ETF (NYSEARCA: MUB ) as well longer-dated Treasuries in the iShares 10-20 Year Treasury Bond ETF (NYSEARCA: TLH ). Currencies like the dollar and the franc can be acquired in the CurrencyShares Swiss Franc Trust ETF (NYSEARCA: FXF ) and UUP. The index also includes gold via the SPDR Gold Trust ETF (NYSEARCA: GLD ). Disclosure: Gary Gordon, MS, CFP is the president of Pacific Park Financial, Inc., a Registered Investment Adviser with the SEC. Gary Gordon, Pacific Park Financial, Inc, and/or its clients may hold positions in the ETFs, mutual funds, and/or any investment asset mentioned above. The commentary does not constitute individualized investment advice. The opinions offered herein are not personalized recommendations to buy, sell or hold securities. At times, issuers of exchange-traded products compensate Pacific Park Financial, Inc. or its subsidiaries for advertising at the ETF Expert web site. ETF Expert content is created independently of any advertising relationships. Editor’s Note: This article discusses one or more securities that do not trade on a major exchange. Please be aware of the risks associated with these stocks.

ETFs For The Unquestioned ‘Wall Of Worry’

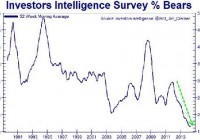
Wall Street stocks often climb in the face of negativity, pessimism and rational fears. With the Fed ending its electronic money printing in the U.S. while hinting at raising overnight lending rates, a continuation of the stock uptrend requires fuel from elsewhere. For now, the bond “wall of worry” and the “stock wall of worry” are not as important as the definitive uptrends for the assets. The crises of yesteryear almost seem quaint. Did investors really need to fret the possibility of the world’s 44th economy (Greece) exiting the euro-zone back in 2011? The stock market ultimately prevailed. Why did the fiscal cliff, sequestration and government shutdown concerns cause so much anxiety in 2012? U.S. stocks eventually powered ahead by roughly 14% that year. Discussion in 2013 of the Federal Reserve tapering its bond purchases in 2014? Please. Equities not only handled the notion of Fed stimulus ending, they knocked doubters on their backsides with two additional years of double-digit percentage gains. Indeed, Wall Street stocks often climb in the face of negativity, pessimism and rational fears. That is what bull markets are made of. On the other hand, when the investing community no longer worries – when the overwhelming majority of participants have no expectation of loss – dreams of risk-free wealth often turn to nightmares. Consider the chart below. The Investors Intelligence Survey’s percentage of self-described bears – those who believe the market will drop – has declined steadily over the last three years. It sits at the lowest level ever. And why not? U.S. stocks have rocketed ahead for three consecutive calendar cycles without so much as a 10% pullback. If every 4%-8% downward movement becomes a “buy-the-dip” opportunity – if people cannot recall the odious feelings associated with a correction of 10%-19% – they’re more likely to chalk up a bearish decline of 30%-plus as an aberration. Trillions in electronic currency creation, zero percent rate policy, corporate stock buybacks, margin debt, carry trade activity, a quest for yield as well as signs of domestic economic improvement have contributed to the amazing six-year performance for U.S. stocks. Of course, none of these things occurred independently. With the Fed ending its electronic money printing in the U.S. while hinting at raising overnight lending rates, a continuation of the stock uptrend requires fuel from elsewhere. Perhaps literally. Unfortunately, and yes, I do mean unfortunately, collapsing oil prices are not a windfall for the U.S. economy. Since 2009, employment in the oil industry has soared by as much as 50%. I have seen reports that energy jobs accounted for 40% of the national job growth since 2000. And these are high-paying careers that we are talking about, as opposed to the low-paying nature of retail, health service professionals and part-time work. The rapid descent in oil prices is a signal of a weakening global economy. Either we see the rest of the globe lose its fight against deflation, eventually dragging the U.S. down with it, or oil prices revert back to a spot price near $75 per barrel and stabilize the world order. I believe the latter is more probable. In fact, if oil fails to find a base that the world and the U.S. energy industry can live with, I believe the Fed will push off its rate normalization plans into the fall or wintertime. (More stimulus, more easy money… that will power stocks in 2015, right?) Indeed, I am long Exxon Mobil (NYSE: XOM ) as a dividend aristocrat that will benefit from greater oil price stability. And while client portfolios stopped out of a profitable position in UBS MLP Alerian Infrastructure (NYSEARCA: MLPI ) back in October, I may revisit the theme of energy infrastructure in the near future. If any sector could benefit from an unquestioned ascent on a “wall of worry,” it could be energy. Or, in contrast, energy could supplant the tech sector circa 2000-2002 and the financial sector circa 2007-2009. A great deal would depend on how Fed policy acts in the face of domestic and global economic deceleration. Will it be the dovish Fed that has maintained zero percent interest rates throughout the six-year bull market? Or will it be a more determined Fed that wants to give itself more breathing room by raising short-term rates, so that it does not need to sign on for QE4? Regardless, investors that have been suckered in by endless promises of rising interest rates need to recognize the unanimous refrain is almost always incorrect. Last year’s Bloomberg poll of the top 55 economists found that all 55 expect the 10-year yield to rise from 3.0%. The average forecast? 3.4%. Only a few folks like myself pointed to the relative value of U.S. treasuries compared with lesser quality sovereign debt abroad as well as the global economic slowdown. As we all know now, the 10-year fell to 2.2% from 3.0%. The economists are at it again. Nearly all of them say the 10-year yield will go higher, with an average forecast of 3.0% by 2015 year-end. I think the 10-year yield will probably be closer to 2%, especially with comparable German bunds below 1% and Japanese government 10-year bonds at 0.31%. Just like last year, I am quite content to keep utilizing longer-duration treasuries in funds like Vanguard Long Term Government Bond (NASDAQ: VGLT ) as well as iShares 10-20 Year Treasury (NYSEARCA: TLH ), as the yield curve continues to compress. Most of my clients have exposure to Vanguard Extend Duration (NYSEARCA: EDV ), though I would look for a bit of a shakedown before considering the longest end of the curve. Bottom line? Check your bond bearishness and stock bullishness at the door. Let the trendlines do the talking for both assets. For now, the bond “wall of worry” and the “stock wall of worry” are not as important as the definitive uptrends for the assets. One should let the uptrends in a stock stalwart like iShares USA Minimum Volatility (NYSEARCA: USMV ) as well as a bond winner like Vanguard Long Term Government ( VGLT ) speak for themselves. Disclosure: Gary Gordon, MS, CFP is the president of Pacific Park Financial, Inc., a Registered Investment Adviser with the SEC. Gary Gordon, Pacific Park Financial, Inc, and/or its clients may hold positions in the ETFs, mutual funds, and/or any investment asset mentioned above. The commentary does not constitute individualized investment advice. The opinions offered herein are not personalized recommendations to buy, sell or hold securities. At times, issuers of exchange-traded products compensate Pacific Park Financial, Inc. or its subsidiaries for advertising at the ETF Expert web site. ETF Expert content is created independently of any advertising relationships.