Tag Archives: nysearcaees

3 Small Cap Value ETFs For Every Type Of Investor

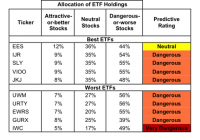
I’ve surveyed the small cap ETF universe and found 3 ETFs I like. I narrowed them down for aggressive investors, conservative investors and average investors. Each ETF has a reasonable expense ratio and is broadly diversified. I am a value investor, meaning I look for stocks that the market hasn’t discovered yet or that are out of favor for some reason. My favorite area for value stocks is the small-cap arena. My best picks over the years have been those that started as small-caps and grew due to their success. It’s these overlooked stocks whose stories I like that I spend most of my time on. However, I can’t spend all my time on them, and that’s why I’ve been hunting down 3 small-cap ETFs to share with aggressive investors, conservative investors, and the average investor. Why own a small-cap ETF? Other than the fact that small-cap stocks have historically outperformed their larger brethren and offer the best chances of obtaining a multi-bagger return, you must have diversification in your portfolio. Sector outperformance occurs all the time, and the more diversification you have, the better. If you don’t have diversification, then you risk seeing your overall portfolio fall more in bad times by having your money overly concentrated. For the aggressive investor, consider the WisdomTree SmallCap Earnings ETF (NYSEARCA: EES ) . This may sound like a silly criteria, but this ETF only invests in earnings generating small-cap companies. Sure, an aggressive investor may not care if a company is generating earnings or not, but I’d argue that’s only true of GROWTH stocks. Value stocks need to be making money to be a value play. EES happens to be a fundamentally weighted index fund, taking the smallest 25% of companies in the universe of profitable small-cap companies, after removing the 500 largest companies. Since the weighting is earnings based, the companies with the largest profits get weighted the most heavily. Now, let’s be sure the ETF is defining “earnings” as what we’d expect it to. The ETF refers to “core earnings,” as defined by Standard & Poor’s, to include expenses, income and activities that reflect the actual profitability of the company. So that’s just fine by me. It’s also broadly diversified with 957 holdings and, as I’d hope for in a small-cap fund, 90% of them are under $2 billion in market cap. Sure enough, even this fund has a 26% weighting in financials, with 18% in industrials, 18% in consumer discretionary, 12% in IT, 9.5% in health care, 6% in energy and 4% in materials. I consider EES to be for the aggressive investor because it is quasi-actively managed. The assumption is that actively managed funds will be a bit more aggressively directed because investors assume management is designed to outperform. That doesn’t necessarily mean there will be greater risk, but that’s often the case. Since its inception on 2/23/07, the fund’s total returns have been 53%, and it has been outperforming its benchmark in the most recent 3-year and under periods. A basic small-cap value ETF choice for the average investor is always going to be found in the Vanguard family of funds. In this case, I look at the Vanguard Small Cap Value ETF (NYSEARCA: VBR ) . Vanguard’s approach toward value securities is to evaluate them based on price-to-book, forward earnings-to-price, historical earnings-to-price, dividend-to-price and sales-to-price ratios. It is a passively managed fund that carries 843 stocks, and the top 10 only account for 4.8% of the total asset base. I like that kind of broad diversification, and like the weighting even more. Financials account for 30.7%, industrials are 20%, consumer services at 13%, technology comes in at 7%, consumer goods is also at 7%, health care at 7%, and energy at 4%. I consider Vanguard for the average investor since it seeks to mirror the benchmark with low fees. Nothing special here. It has essentially matched the Russell 2000 Value index for a 37% return since February 2007. It has a 114% total return over the past ten years, and 104% over the past five years. For the more conservative investor, the iShares Russell 2000 Value ETF (NYSEARCA: IWN ) . This $5.61 billion market cap ETF was launched in 2000, so there’s a long enough track record for me to evaluate it as being appropriate for this class of investor. It is very well diversified with 1,314 holdings. The ETF basically takes the Russell 2000 index and pulls out companies that have value characteristics in the broadest possible sense. The average price-to-earnings ratio is 14.19, which is quite a bit lower than in recent months, making it particularly attractive. Financials account for 43% of the ETF, which is a bit more than I’d like, but the vast number of holdings offsets it to some degree. Industrials account for 12%, consumer discretionary comes in at 10.74%, information technology at 10.25%, utilities at 7%, materials at 3%, energy at 4.6% and the rest falls into health care, consumer staples and derivatives. As a conservative fund, it aims for true value plays so that downside risk is limited, but upside gains can take longer to develop. For example, it only has a 12% return since February of 2007. However, it has a 172% return over fifteen years. As with any article regarding investments, you should never rely on information you read without doing your own due diligence. My articles contain my honest, forthright and carefully considered personal opinion, and conclusions, containing information derived from my own research. This may include discussions with management. I do not repeat “talking points” but may quote management from an interview. I am never influenced by third parties in arriving at my conclusions. Do not solely rely on my articles or anyone else’s when making an investment decision. Always contact your financial advisor before investing in any security. Disclosure: I/we have no positions in any stocks mentioned, and no plans to initiate any positions within the next 72 hours. (More…) I wrote this article myself, and it expresses my own opinions. I am not receiving compensation for it (other than from Seeking Alpha). I have no business relationship with any company whose stock is mentioned in this article.

Best And Worst: Small Cap Blend ETFs, Mutual Funds And Key Holdings

Summary Small Cap Blend style ranks last in Q2’15. Based on an aggregation of ratings of 29 ETFs and 678 mutual funds. EES is our top rated Small Cap Blend ETF and PXQSX is our top rated Small Cap Blend mutual fund. The Small Cap Blend style ranks 12th out of the 12 fund styles as detailed in our Q2’15 Style Rankings report . It gets our Dangerous rating, which is based on an aggregation of ratings of 29 ETFs and 678 mutual funds in the Small Cap Blend style. Figures 1 and 2 show the five best and worst rated ETFs and mutual funds in the style. Not all Small Cap Blend style ETFs and mutual funds are created the same. The number of holdings varies widely (from 24 to 2544). This variation creates drastically different investment implications and, therefore, ratings. Investors seeking exposure to the Small Cap Blend style should buy one of the Attractive-or-better rated ETFs or mutual funds from Figures 1 and 2. Figure 1: ETFs with the Best & Worst Ratings – Top 5 (click to enlarge) * Best ETFs exclude ETFs with TNAs less than $100 million for inadequate liquidity. A total of six ETFs are excluded from Figure 1 because their total net assets are below $100 million and do not meet our liquidity minimums. Figure 2: Mutual Funds with the Best & Worst Ratings – Top 5 (click to enlarge) * Best mutual funds exclude funds with TNAs less than $100 million for inadequate liquidity. A total of five mutual funds are excluded from Figure 1 because their total net assets (TNA) are below $100 million and do not meet our liquidity minimums. The WisdomTree SmallCap Earnings ETF (NYSEARCA: EES ) is our top-rated Small Cap Blend Style ETF and the Virtus Quality Small-Cap Fund (MUTF: PXQSX ) is our top-rated Small Cap Blend Style mutual fund. EES earns a Neutral rating and PXQSX earns an Attractive rating. One of our favorite stocks held by Small Cap Blend funds is The Buckle Inc. (NYSE: BKE ). Buckle is a casual apparel, footwear and accessories retailer. As a retailer, the company has achieved very consistent financial performance. Over the last decade Buckle has grown after-tax operating profit ( NOPAT ) by 17% compounded annually. Buckle’s return on invested capital ( ROIC ) in 2014 was 32%, placing it in the top quintile of all companies we cover. Over the past seven years ROIC has never fallen below 28% indicating a very resilient business franchise. Given its strong fundamentals, The Buckle is currently undervalued. At its current price of ~$47/share, BKE has a price to economic book value ( PEBV ) ratio of 1.0. This ratio implies the market expects Buckle’s NOPAT to never grow from current levels. However if the company is able to grow NOPAT by just 6% compounded annually for the next 10 years the stock is worth $73/share today – a 55% upside. The iShares Micro-Cap ETF (NYSEARCA: IWC ) is our worst-rated Small Cap Blend style ETF and the Chartwell Small Cap Value Fund (MUTF: CWSVX ) is our worst-rated Small Cap Blend style mutual fund. Both earn our Very Dangerous rating. One of our least favorite stocks held by Small Cap Blend funds is Mobile Mini (NASDAQ: MINI ). Since 2009, Mobile Mini’s NOPAT has not grown at all, and in fact has declined by $2 million. The company’s ROIC has not risen either, and at only 4% in 2014, ranks in the bottom quintile of all companies we cover. To top it off, Mobile Mini has not generated positive economic earnings in any year for the last 16 years. However, to justify its current price of ~$43/share, Mobile Mini must grow NOPAT by 13% compounded annually for the next 18 years . A history of stagnant NOPAT coupled with poor profitability make Mobile Mini an overvalued stock. The expectations implied by the current price are just too high given the actual economics of the business. Figures 3 and 4 show the rating landscape of all Small Cap Blend ETFs and mutual funds. Figure 3: Separating the Best ETFs From the Worst ETFs (click to enlarge) Figure 4: Separating the Best Mutual Funds From the Worst Funds (click to enlarge) Sources Figures 1-4: New Constructs, LLC and company filings D isclosure: David Trainer owns BKE. David Trainer and Allen L. Jackson receive no compensation to write about any specific stock, style, style or theme. Disclosure: I am/we are long BKE. (More…) I wrote this article myself, and it expresses my own opinions. I am not receiving compensation for it. I have no business relationship with any company whose stock is mentioned in this article.

Proof Positive That U.S. Stock ETFs Are Not The Only Place To Be

Financial professionals are blaming the latest round of risk asset uncertainty on a variety of factors, from the continuing sell-off in oil to the possibility of Greece being kicked out of the euro-zone. Still others are pointing to anxiety over the U.S. Federal Reserve’s intention to raise its overnight lending rate target in mid-2015 – the first move of its kind since December of 2008. Meanwhile, the biggest names in bonds have added fuel to the fire. Bill Gross at Janus has declared that the good times are over; he anticipates a plethora of “minus signs” in front of riskier asset classes by year-end. Similarly, Jeff Gundlach of DoubleLine believes the U.S. 10-year yield will test 1.38% from its 2.0% level. That is in sharp contrast to the unanimous verdict of economists that the 10-year would be sharply higher; the average expectation is 3.0% by December. Since the beginning of last year, I have argued the exact opposite and extolled the virtues of owning long-maturity treasuries via the Vanguard Extended Duration ETF (NYSEARCA: EDV ) and/or the Vanguard Long Term Government Bond Index ETF (NASDAQ: VGLT ). The yields on these safer havens have been more favorable than the sovereign debt of beleaguered foreign governments in the developed world. Even today, a 10-year U.S. Treasury at 2.0% compares quite favorably with German bunds (0.5%) and Japanese government bonds (0.3%). A wide variety of international and emerging market stock assets floundered in 2014, and they have continued to descend in the New Year. Yet it may come as a shock to some buy-the-dip enthusiasts that many U.S. stock ETFs have already broken below key support levels. The ones that I have identified in the chart below are currently below 200-day long-term trendlines (exponential). Paradise Lost? U.S. Stock ETFs Begin Falling Below Respective Trendlines % Below 200 Day SPDR Select Energy (NYSEARCA: XLE ) -17.1% Vanguard Materials (NYSEARCA: VAW ) -3.1% SPDR KBW Bank (NYSEARCA: KBE ) -2.0% Market Vectors Morningstar Wide Moat (NYSEARCA: MOAT ) -1.8% Guggenheim S&P 500 Pure Value (NYSEARCA: RPV ) -1.2% WisdomTree Small Cap Earnings (NYSEARCA: EES ) -0.9% RBS U.S. Midcap Trendpilot ETN (NYSEARCA: TRNM ) -0.9% Fidelity Telecom (NYSEARCA: FCOM ) -0.4% RBS U.S. NASDAQ 100 Trendpilot ETN (NYSEARCA: TNDQ ) -0.2% First Trust Internet (NYSEARCA: FDN ) -0.1% While nobody can predict whether the current flight from risk will be yet another head fake – investors have snapped up U.S. stock shares on every 4%-8% pullback since the winter of 2011 – extreme movements in both commodities and currencies in recent months do not bode well for the bulls. For example, dramatic falls in the price of crude oil historically correlate with an increase in geopolitical and economic crises. Does anyone believe that Wall Street can continue to ignore an uptick in overseas strife at the same time that the energy sector is reeling stateside? Similarly, the swift appreciation of the U.S. dollar and the quick depreciation of other world currencies over the last six months is likely to reduce the desire for carry trade activity and/or increase the desire to take some “chips off the table.” In other words, assets like the PowerShares DB USD Bullish ETF (NYSEARCA: UUP ) can be safe havens from stock turbulence, yet the ripple effects can create a desire for a reduction in risk taking across the board and an increase in desire for U.S. Treasury bonds. As an advocate for long-duration treasuries since the first week of January 2014 – as one who wrote at great length about the virtues of a barbell approach in a late-stage stock bull – I decided to investigate the unusually high positive correlation of two of my largest holdings, EDV and the Vanguard Dividend Appreciation ETF (NYSEARCA: VIG ). Historically speaking, treasuries and stocks have a slight positive correlation in good times and a strong negative correlation in bad times. That’s why 2014 represented an unlikely scenario where matching “risk-off” capital preservation with “risk-on” capital appreciation produced risk-adjusted gains that far exceeded stocks alone. Although CNBC would rather talk about the remarkable run in U.S. equities, there has been an unwillingness to address the extraordinary success of “risk-off” assets like EDV. On the contrary. The unanimous expectation for 55 of the leading economists in the country had been for the 3.0% 10-year yield to climb in 2014, with an average projection of 3.4%. It fell to 2.2.% The unanimous decision this time around is for the 10-year to rise from 2.2% to 3.0% in 2015. Alas, it is falling yet again here in the New Year. Granted, I may not be the only contrarian on middle-of-the-yield-curve rates, but I do not run a bond fund and I have plenty of stock exposure. I just know when and how to employ multi-asset stock hedging. Until we see a genuine bear scare, I do not expect tremendous coverage of the index that I helped to create with FTSE-Russell, the FTSE Custom Multi-Asset Stock Hedge Index . I affectionately refer to it as the “MASH” Index. Yet it should be noted that there are a variety of currencies, commodities, foreign bonds and U.S. bonds that have a history of exceptionally low correlations with U.S. stocks. What’s more, low correlations do not mean poor performance when stocks are soaring and great performance when stocks are struggling. It simply means that the assets move independently. That said, month-over-month, the FTSE Custom Multi-Asset Stock Hedge Index (a.k.a. “MASH”) is up 2.5% whereas the Dow logged -2.6%. Year-over-year? MASH gained 6.8% while the Dow picked up 6.3%. Granted, the last month demonstrates that multi-asset stock hedging works particularly well when stocks struggle, but it is hardly a prerequisite. The year-over-year results show that the index can garner admirable gains – better the t-bills or money markets – even in a stock uptrend. An investor can not invest in the FTSE Custom Multi-Asset Stock Hedge Index (MASH) directly yet, though an exchange-traded note is likely to appear in 2015. Do-it-yourself enthusiasts may acquire index components such as zero coupon bonds via the PIMCO 25+ Year Zero Coupon U.S. Treasury Index ETF (NYSEARCA: ZROZ ), the iShares National AMT-Free Muni Bond ETF (NYSEARCA: MUB ) as well longer-dated Treasuries in the iShares 10-20 Year Treasury Bond ETF (NYSEARCA: TLH ). Currencies like the dollar and the franc can be acquired in the CurrencyShares Swiss Franc Trust ETF (NYSEARCA: FXF ) and UUP. The index also includes gold via the SPDR Gold Trust ETF (NYSEARCA: GLD ). Disclosure: Gary Gordon, MS, CFP is the president of Pacific Park Financial, Inc., a Registered Investment Adviser with the SEC. Gary Gordon, Pacific Park Financial, Inc, and/or its clients may hold positions in the ETFs, mutual funds, and/or any investment asset mentioned above. The commentary does not constitute individualized investment advice. The opinions offered herein are not personalized recommendations to buy, sell or hold securities. At times, issuers of exchange-traded products compensate Pacific Park Financial, Inc. or its subsidiaries for advertising at the ETF Expert web site. ETF Expert content is created independently of any advertising relationships. Editor’s Note: This article discusses one or more securities that do not trade on a major exchange. Please be aware of the risks associated with these stocks.