Tag Archives: seeking

NextEra Energy, Part 2: Leadership Seen In Diversity, Community, And Renewable Energy
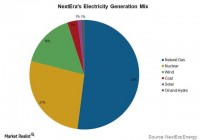
Summary The company ranks very well in diversity hiring, community involvement, and renewable energy. The company does not rate well in women hiring, green productivity, and has limited information in other places. We believe NEE is overall a strong leader in social responsibility. In Part 1 of this article, we saw that NextEra (NYSE: NEE ) is, at this time, not a “buy” for us. We see the upper limit of 2015 pricing in the $105-$110 range, and that the company’s fair value sits in the mid-$80s. Essentially, the company is not a buy for us from a purely financial standpoint. In this part of our research, we will focus on the socially responsible aspects of the company. Our findings are very promising. Yet, failing to see an upside in general, we cannot make an overall positive comment. The company should be respected for its work in socially responsible ways. Socially Responsible Scorecard There are many ways to understand and develop socially responsible investing (SRI). What is “responsible” for each person is vastly different, and what might be “responsible” to one person might be “irresponsible” to others. That is the toughest part of investigating companies for SRI. While pure capitalism to some is the most responsible approach to business, others may see that this could harm other areas such as environmental stewardship or economic development. Others may believe too much capital invested into socially conscientious programs could hurt profits and investors. Therefore, we will try to present as much information as we can to render the best opinion possible. Overall, socially responsible investments are more about leadership and paving the way, rather than compliance. Compliance is doing what is required, while corporate responsibility is about leading and doing more than is required. Companies that lead are always the most respected in the long term, and we believe provide both a safe investment platform as well as peace of mind. The criteria we use to examine the company’s overall social responsibility theme are gender equality, employment and diversity, environmental stewardship, leadership values and community involvement. With all research, some areas have more quantifiable parts, while in other areas, there is not as much. We base our research in taking an aggregate look at leading think tanks, research firms and important websites that cover these topics. We split this research into the aforementioned topics to help create a more holistic opinion. Overview NextEra appears to be a leading firm in the SRI space with strong showing in many key areas. The company was rated as a coveted Ethisphere World’s Most Ethical Companies in the 2014 edition, which shows a dedication to be a leading firm that goes above and beyond compliance. They lead in a number of areas with diversity hires, green energy, and a clear intention for community involvement. The company’s CSR Hub rankings did not show a strong lead, but they were above average. Their “Overall” rating comes in at 60, while Employees and Environment lead the way at 66 and 64, respectively. The company is above average, according to the Hub. The company, though, has won many awards and is a leader in a space that is one of the largest polluters. When we search for companies, we look for the ones that are leaders in various areas of business. NEE appears to be that way. Take a look at the company’s awards here . Some of the most interesting awards we have seen are: — ServiceOne Award for Exceptional Customer Service — Best Employees for Healthy Lifestyles – The Fortunes’s Most Admired Companies Award: In 2014, NextEra Energy was named No. 1 among electric and gas utilities for an unprecedented eighth straight year on Fortune magazine’s listing of “Most Admired Companies.” In that same Fortune survey, the company was named No. 1 electric and gas utility in innovation, No. 1 in social responsibility and No. 1 in quality of products and services. Workforce – Diversity, Compensation, Gender Equality NextEra’s is actually quite strong in their approach to diversity, equality, and compensation, serving as a leader in the way companies should approach their workforce. We believe this is very socially responsible and commendable. The company has been recognized as a top leader in hiring veterans and Hispanics. The company has been recognized by Hispanic Business magazine since 2010 as one of the leaders in diversity hiring. As the award states, “(they) determine the list, the magazine analyzed data on companies’ boards of directors and leadership, recruitment, retention and promotion, marketing and community outreach, and supplier diversity.” As for veterans, ” Vetrepreneur magazine, the voice of the National Veteran-Owned Business Association, gave FPL honorable mention in its compilation of the 2011 Best 10 Corporations for Veteran-Owned Businesses.” The company rates well in other areas of its workforce as well. The Human Rights Campaign rates the company as a 70, which is a rating system for a companies rights to gay, lesbian, and transgender employees. The company has the same rights for same-sex partners as opposite-sex partners and spouses outside of relocation assistance. The company’s 70 rating puts them at the upper end of the rating scale. The company is recognized as well as being one of the companies to have non-discrimination policies for sexual orientation as well. The company didn’t have much information on gender equality for hiring, but the diversity aspect is very positive. As for worker compensation, the company rated a 58 by CSR Hub for worker compensation. The company, though, has positive ratings for safety and health benefits. The company won Best Employers for Healthy Lifestyles for the eighth time for “its ongoing commitment to promoting a healthy work environment and encouraging its workers to live healthier lifestyles. The company was one of just two Florida-based companies and one of only two companies in the energy sector to receive the 2013 Best Employers for Healthy Lifestyles® Award in the prestigious Platinum category.” What we are seeing from the company is a dedication to a workforce and a dedication to policy that promotes safety, diversity, and compensation. We believe this is a leader in this arena, and it complements well their placement as a leading green energy utility. Green Initiative The company has been most recognized for its leadership in green energy. The company is in one of the dirtiest industries, and their reputation is strong. Yet, there are some weaknesses/improvements that need to be made. For as many green awards as the company has won, there are still improvements to be made. Just take a look at this chart to start: (click to enlarge) Despite being labeled the “green” utility, the company is using nearly over 50% in natural gas still, and they also use over a quarter in nuclear, which has some very negative consequences on society if not managed properly as well as waste concerns. In face, the company is really only about 17% actual “green” energy. Further, the company is not the cleanest utility out here. (click to enlarge) The company is definitely one of the cleanest, but it is not as clean as some of the best, and that mix could continue to improve. The company is a “leader,” but we should also understand that this is a company that still uses 50% of their fuel in natural gas. Newsweek’s Green List ranked the company 209th on its Green List, which is one of the most comprehensive looks at companies in the marketplace. This list, though, ranks companies fairly across the board and does not quantify their industry. Naturally, a utility company is going to struggle. The company rated at only 10%, 18%, and 13%, on their energy, carbon, and water productivity out of 100%. The company rated very well, though, on reputation. Out of utilities, the company ranked 15th, which is not exceptional especially given their reputation. Also troubling was the company’s decision not to respond to the Carbon Disclosure Project since 2010. The company did rate an 82 in 2009, which is a decent rating. What is troubling, though, is the CDP is one of the leading, respected firms for rating company plans for carbon versus actual carbon productivity. It is not rating on a single scale but looking at all companies individually. Yet, the company has won numerous awards as you can see here . The company is continuously rated in the Dow Jones Sustainability Index and was rated the best utility for renewable energy by EI New Energy. The company has been rated well for its top electric fleet, and it is rated well for their care and dedication to trees. Overall, the company has solid awards and is rated decently, but we are not as sold as these awards given that some of the leading research gatherers have not gotten necessary information or rated it as well when compared to its competition. What is definitely positive is the company’s leadership that they are the top renewable energy producer. It is an industry that is still mostly based in coal, oil, and natural gas, so the company is better in that regard. Yet, the company’s efficiency ratings aren’t as strong, which is something to consider. Additionally, the nuclear energy angle is considered part of renewable energy, but we are not high on this form of energy due to the direct social risk from it that may be even higher than non-renewable sources. Overall, we would like to see a continued reduction in natural gas and increases in wind and solar power. The company is very low on coal, which is great, and they do help bring other utilities into the mix into these renewable sources. There is still much work to be done. Community Involvement NextEra appears to have a pretty comprehensive strong approach to community. Not only do they rate quite well on their diversity hiring, but they are also leading the renewable utility energy game, which is also positive for the community. Yet, the company also has a very comprehensive direct community plan to volunteer, donate, and be involved in their communities. The company’s 22,000 hours of volunteer time in 2011 in their community and a whole week called Power to Care show some definite leading energy being put back into the community. You can read more about the company’s difference making here . The company has a very progressive hiring plan also for military volunteers that falls into the company’s Diversity Inclusion division that we believe is really respectable. In November, the company was awarded an “Above and Beyond” award in Florida for their strong military hiring program. As a retail company as well, the company has won numerous awards for their customer satisfaction and service. The information we collected here was more limited, but the company definitely appears on the right track. The unseen benefits are what excite us most with their efforts in renewable energy and diversity leadership. Conclusion As you can see, NextEra is a leader in quite a number of areas of social responsibility, but we do have concerns in some areas. We would note they are one of the top companies that are public today, though. Right now, they rate high for us in social responsibility, but we are not as high on their price analysis. We would love to add them on any slight dip in valuation to a socially responsibly crafted investment plan. Disclosure: The author has no positions in any stocks mentioned, and no plans to initiate any positions within the next 72 hours. (More…) The author wrote this article themselves, and it expresses their own opinions. The author is not receiving compensation for it (other than from Seeking Alpha). The author has no business relationship with any company whose stock is mentioned in this article.

Bull Markets Climb A Wall Of Worry — So Where Are We Now?

Summary Bull markets climb a wall of worry. Bull markets end when no one is any longer worried about anything. There plenty to worry about right now. Does that mean we should expect a good market going forward? Bull markets climb a wall of worry. Bull markets end when no one is any longer worried about anything. Bear markets then decline as more and more investors throw in the towel. Bear markets end when most investors swear off investing in the market. Why this reminder? One of our clients wrote last month and asked if I believed we should be in the market at all. Consider, after all: Europe is in shambles. China is decelerating. Oil, gas and most essential commodities are down, down, down and face a glut as there is more supply than demand for almost all of them right now. 4th-quarter earnings of US companies are only so-so. Expectations have been lowered hugely for 2015 future earnings. Our president speaks of helping the middle class, yet his policies have harmed working families the most. We’ve never reached such heights in the market. Mark Hulbert, who monitors and reports on a subset of financial writers, began a recent article, “The U.S. stock market’s major trend now is down, so act accordingly.” This bull is older than almost every bull market in history. Etc., etc. All true. All worrisome. But bull markets climb a wall of worry. It’s possible, of course, that this particular one will end with a failure to break out and without the usual euphoria that typically accompanies the end of a bull. Or maybe it ended in December, with that euphoria, and now it is merely gasping for air. (Mr. Hulbert’s piece, citing 2 of 3 adherents of Dow Theory, seems to suggest this as a distinct possibility.) If this is the case, we’ll add to our defensive positions – but I don’t believe it is. Here is what I see in the coming year in both the markets and the economy… While our firm practices asset allocation for about 85% of our, and our clients’, portfolios, we are not dogmatic about it. If there is an obvious opportunity like, say, buying the biggest and best oil companies with a view to long-term recovery, we will slightly change our reallocation matrix to over-weight this or that sector or asset class. We do this knowing we may sacrifice small gains in the short term for significantly larger gains in the future. We live in the present and plan to live even better in the future, so that’s the way we invest. With that in mind, here’s our take on… U.S. Stocks I don’t believe this will be as great a year as “most” years ending in “5” (which has nothing to do with numerology and much to do with the U.S. federal election cycle.) But I still expect to see a single-digit gain (5%? 7%?) this year. Once we hit the summer doldrums, we might or might not hang onto those gains. Still, as I survey the other possibilities (CDs and bonds providing negative returns after taxes and inflation, emerging markets stung by the strong dollar, commodities slumping from low demand, etc.) I think companies selling products and services to U.S. consumers – think small- and mid-cap domestic firms – are the best bet on the immediate horizon. Some of our favorite funds in this area are Aston / LMCG Small Cap Growth N (MUTF: ACWDX ), Guggenheim Spin-Off (NYSEARCA: CSD ), Akre Focus (MUTF: AKREX ) and TrimTabs Float Shrink (TTFS.) Can We Make Money in Bonds? Sure we can. As long as central bankers are rushing to duplicate the success the USA has begun to enjoy as a result of slashing interest rates to the point where “who wouldn’t” take a 30-year fixed mortgage at 3.75% or an auto loan at 0%. We’ll always keep “some” amount of our allocation in US bonds, not for their returns but for their shelter from the storm. But this year I think we can see much better returns buying quality foreign bonds via ETFs and actively managed mutual funds. As Japan, Australia, Canada, Europe, et al, slash rates, their existing bonds paying higher rates become more desirable and begin to appreciate. That’s why PIMCO Foreign Bond (USD-Hedged) D (MUTF: PFODX ) is our largest position in our Investor’s Edge Growth & Value portfolio. Among US funds, we prefer the beaten-down hi-yield funds to their more conservative brethren right now. PIMCO Income A (MUTF: PONAX ) and Guggenheim Bulletshares 2015 (NYSEARCA: BSJF ) come to mind. Currencies We don’t trade the currency markets. We have just one direct position in the US $, some options in the Aggressive Portfolio. But indirectly , it is the strength of the dollar that leads us to believe this year will be better for the small and mid cap firms that don’t get paid in Euros, Yen or Yuan and then must repatriate those currencies into fewer dollars. I believe there will be great turbulence in the currency markets this year as nations jockey to ensure they maintain trade supremacy by doing whatever they can to control their currencies. This is not an arena we choose to compete in; central bankers have slightly more resources to get their way than those of us who work for a living. Commodity Products We do not invest directly in commodities. If you think it’s tough to compete against central bankers, try going head to head with the best minds private industry can buy. At least central bankers have proven themselves inept from time to time; I don’t want to compete in the sugar trading business with Coca Cola (NYSE: KO ) or in the oil business with Exxon (NYSE: XOM ). I’m thinking their pockets are, again, slightly deeper than mine and their very livelihood depends upon being right more often than they are wrong. Still, the price of oil in the USA, wheat in Canada or tea in China does affect our investing, and I imagine this year will not be kind to sectors that rely upon more demand than supply for their profitability. I think oil is likely to be the big exception; the selloff has been more severe than companies’ revenues justify and the Bigs are slashing CapEx left and right. As for the US and World Economies The markets are predictive of the economy, not coincident to it. But financial journalists must write about market ups and downs and saying, truthfully, “Hell, we don’t know why it was down 300 today,” must cite something. That’s why they say, “The market was crushed today because GDP came in 0.3% below expectations” or “The market soared today because Alcoa delivered an upside earnings surprise.” Since we believe the markets to be predictive of future economic trends, it follows that we see the macro-economic environment unfolding something like this in 2015: We believe volatility has returned with a vengeance. If you can’t take the occasional 300-point down day without having your cardiologist on call, buy bonds. Inflation is DOA right now and likely to remain so for most of the world for this year. Europe and Japan may well surprise on the upside as they stimulate their economies. Most emerging markets will be moribund. There will be exceptions. The housing recovery will accelerate, as will consumer spending. Capital spending and wage growth won’t accelerate, however, keeping growth steady but not exciting. A Fed rate increase in June? I doubt it; the strong US$ is already cutting into exports. This is no time to make it worse. Still, humans sit on the board of the Fed. They’ve cried wolf so many times, they may initiate a token increase just to show, um, demonstrate, er, pretend they are in charge of the economy rather than the other way around. ————— As Registered Investment Advisors, we believe it is our responsibility to advise that we do not know your personal financial situation, so the information contained in this communiqué represents the opinions of the staff of Stanford Wealth Management, and should not be construed as personalized investment advice. Past performance is no guarantee of future results, rather an obvious statement but clearly too often unheeded judging by the number of investors who buy the current #1 mutual fund one year only to watch it plummet the following year. We encourage you to do your own due diligence on issues we discuss to see if they might be of value in your own investing. We take our responsibility to offer intelligent commentary seriously, but it should not be assumed that investing in any securities we are investing in will always be profitable. We do our best to get it right, and we “eat our own cooking,” but we could be wrong, hence our full disclosure as to whether we own or are buying the investments we write about. Disclosure: The author is long ACWDX, AKREX, DRESX, HDPSX, SCHH, DBEF, DTN, ROOF, DFE, SCHG, VONE. (More…) The author wrote this article themselves, and it expresses their own opinions. The author is not receiving compensation for it. The author has no business relationship with any company whose stock is mentioned in this article.

GURU And ALFA: Are Hedge Fund ETFs Worth Your While?

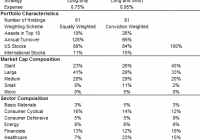
Summary There has been a great deal of interest in ‘hedge fund cloning’ ETFs of late. Despite exhibiting decent performance, a closer look reveals a different story. We remain skeptical of their alpha potential, after a detailed analysis of their track record. There has been significant interest in recent years in “cloning” the equity investment ideas of hedge funds, leading to the launch of several ETFs and indices that track their stock picks. In this article we provide an assessment of the two longest running ETFs, the Global X Guru Index ETF (NYSEARCA: GURU ) and the AlphaClone Alternative Alpha ETF (NYSEARCA: ALFA ). GURU and ALFA At a Glance Despite both being “copy-cat” funds, GURU and ALFA are actually two quite different propositions. Key Features From an investment strategy perspective, the GURU is designed to be 100% long, while the ALFA has the flexibility to go short by 50% subject to market technicals. In other words, one is a long-only equity fund, while the other aims to mimic long/short equity hedge funds by altering its market exposure over time. Due to its hedging ability, the ALFA appears to charge more for this feature, with the expense ratio close to 1%. Portfolio Characteristics A key difference between the two ETFs is their stock weighting methodology. GURU weights its positions equally, and has fewer positions in total. The ALFA applies variable weighting, with higher weights assigned to higher conviction names based on a proprietary scoring methodology. It is more concentrated than GURU in the top holdings, but has a long tail of smaller positions. It is difficult to say which method is more effective, only time will tell. Both portfolios comprise mainly of U.S. stocks, which is intuitive as hedge funds do not disclose their overseas holdings in 13F filings – unless they are U.S.-listed securities, such as ADRs. In terms of portfolio churn, both ETF portfolios have fairly high turnover ratios. For GURU, this is at a staggering 128%. We believe a high turnover is only justified if it results in superior performance, otherwise it typically cranks up excessive trading costs and impacts long-term returns. Portfolio Composition According to Morningstar classifications, both ETFs have a pronounced mid/small-cap bias, as evidenced by their high allocation to SMID cap stocks. The ALFA has a more aggressive tilt than the GURU. From a sector perspective, we would note the high allocation to the tech sector of both funds, although it is not too far from market index weights, as defined by the Russell 1000 Index. Performance Benchmark As both ETFs are essentially U.S. equity funds and exhibit a mid-cap orientation, we believe the Russell 1000 Index (“R1000”) is an appropriate performance yardstick. The Vanguard Russell 1000 ETF (NASDAQ: VONE ) tracks this benchmark and charges a 0.12% fee. Quantitative Analysis – Last 31 Months (1 Jul 2012 – 31 Jan 2015) Below is a summary table of key MPT statistics for the past 31 months, based on monthly data. Investment Results Both the GURU and ALFA have done well over the past 31 months (since common inception date), posting modest outperformance versus the Russell 1000 Index. Risk Both ETFs have exhibited higher volatility than the R1000 (as measured by the standard deviation). At ~11%, this is some 30% higher than the market index. From a beta perspective (sensitivity to equity market movements), both are also higher, at 1.20 and 1.08 respectively. Alpha Alpha is a measure of manager skill on a risk-adjusted basis, in other words it reconciles return and volatility to provide an indication of stocking picking skill. After accounting for volatility, the GURU’s alpha is negative, and the ALFA’s is mildly positive. GURU’s outperformance over the R1000 appears to have been achieved with higher risk. At 1.2 beta, it is akin to R1000 running on steroids, but less efficient. To illustrate this point, if we levered the R1000 to a similar level (beta of 1.2x), this would have yielded better returns at lower volatility. Tracking Error GURU and ALFA are both high tracking error products, meaning their performance pattern can diverge significantly from the R1000 from time to time (both positive and negative) — and benchmark-aware investors should be prepared to stomach this performance divergence. Risk Adjusted Returns Both ETFs have posted identical and good risk-adjusted returns in terms of Sharpe Ratio. However, the slightly levered R1000 once again leaves both ETFs in the dust. Taking It All Together Despite outperforming the R1000 Index in the past 31 months, the alpha of these ETFs are not significant (and negative for GURU), after taking into account their volatility. A Longer Term Perspective For better understanding of the performance pattern of these ETFs, we can look at the indices that they track, which has been back-tested over longer periods. However, one must note that these are “back-tests” and must be treated with a degree of caution. After all, a back-tested index must demonstrate favorable results before a ETF provider is willing to wrap it into an investment product. We do not know how conservative the index producers have been with their assumptions, so we will look no further back than the past 60 months (or five years). 60 Month Statistics (1 Feb 2010 – 31 Jan 2015) The longer term stats paint a similar picture. Guru Index Alpha is again negative over the past five years. Its higher return is explained by higher beta. A similar version (1.1x) of the R1000 would have achieved higher returns at lower levels of volatility. AlphaClone Index Alpha is high at 4.6. This number is a result of a) lower volatility than the R1000 and b) similar level of return. Its 60-month beta is 0.66, a third of the market index. This implies that its market hedge mechanism must have kicked in during this 60 month period, which has provided some protection in down months of the R1000. Despite the existence of alpha, we would note the following: In the period since the ALFA ETF has been live, hedging has not been used, as indicated by its beta of 1.1 to the R1000. It would be interesting to see how it works in practice in the future. In absolute return terms, the back-tested performance of ALFA over the past 60 months is still inferior to the R1000 (15.2 vs. 15.8). A skillful equity long/short hedge fund manager would typically be able to capture less downside, but a similar level of upside, resulting in better returns than the market index over time. This indicates that AlphaClone’s market hedge (think of it as the manager’s skill in shorting the market) have not helped drive extra returns over this 60 month period. A Closer Look at Alpha Patterns We believe outperformance from stock selection comes in waves, and is not constant. There will be extended periods when a portfolio performs well, and extended periods less well due to the existence of style biases (i.e. growth, value, size effect etc). These biases can be in, or out of favor with the market from time to time. To assess alpha patterns we look at the rolling 2-year excess returns versus the R1000. Our assessment period is the last 60 months, as above. Interestingly, the Guru Index has been losing altitude of late, with its margin of outperformance vs. the R1000 dropping fast. This points to a deterioration in its stock selection — possibly due to style biases, a decline in the performance of hedge funds they track, the efficacy of their cloning process, or a combination. Meanwhile, the AlphaClone Index has lagged the R1000 for years (on a rolling 2 year basis), before taking a positive turn in late 2013. This is most likely because the index has very much been long-only and not market hedged since then. Tracking Quality One final factor to consider is the quality of index replication. The good news is that both ETFs appeared to have tracked their underlying indices well after fees in real life. The tracking error is marginally higher for the GURU in the past two calendar years, despite having a lower fee than the ALFA. Our Verdict Over the past 31 months, the GURU and ALFA ETFs have performed well in absolute terms, although if one takes a closer look, reveals a different story. For GURU, we are concerned of its high beta, high portfolio turnover, and stock selection efficacy which has been decreasing recently. For ALFA, we are not big fans of its higher fees and market hedge, which has not been tested in real life. As long-term equity investors interested in maximum capital appreciation, we do not believe that market timing adds value. This is confirmed by the ALFA’s subpar returns to the R1000 over the period under review. Based on our analysis, we remain skeptical of both ETFs’ alpha potential. Disclosure: The author has no positions in any stocks mentioned, and no plans to initiate any positions within the next 72 hours. (More…) The author wrote this article themselves, and it expresses their own opinions. The author is not receiving compensation for it (other than from Seeking Alpha). The author has no business relationship with any company whose stock is mentioned in this article. Additional disclosure: For research purposes, Real Return Partners LLP compile the RR Partners AlphaEquity® Index (Bloomberg: RRALPHA). This is a long-only equity index that tracks the performance of a portfolio of 20 US-listed, 13F equity positions representing the best ideas of an elite group of institutional money managers. The Index is independently calculated and is published as a net total return index. There are no investment products linked to this index.