Tag Archives: seeking

TransCanada Corporation: Long-Term Value From Growth Projects And MLP Drop-Downs

TransCanada has $45 billion of commercially secured projects and $50 billion of projects under evaluation. Drop-downs to TCP represent efficient capital plan. Energy East stakeholder agreement could serve as catalyst. TransCanada Corporation (NYSE: TRP ) owns several key natural gas pipelines, power generation, and natural gas storage assets in North America. The company owns and operates about 42,000 miles of natural gas pipelines and 406 Bcf of storage capacity. In addition, TRP has 11,800 MW of power generation operations in place and under development across hydro, gas, nuclear, and coal. We believe that TRP’s organic developments, aside from Keystone XL, multi-billion portfolio of commercially secured projects, and ability to deploy capital into attractive new projects provide for about 15% upside from current prices. Due to TRP’s large scale and expansive network, the firm has access to some of the most attractive growth projects, which we think are not accounted for in the stock’s current valuation. Currently, TransCanada has $45 billion of commercially secured projects and $50 billion of projects under evaluation. In particular, we think that the new long-term contracts for ANR and higher capacity prices for Ravenswood signal positive developments that would benefit long-term earnings. The ANR Pipeline is one of the largest natural gas pipelines in North America, connecting Wisconsin, Michigan, Illinois, and Ohio with supply in Texas, Oklahoma, and the Gulf of Mexico. We would note that the new contracts demonstrate ANR’s quality even during times of low commodity prices. On the power generation side, Ravenswood Generating Station is a 2,480 MW power plant located in Queens, NY that has the capability to serve 21% of New York City’s peak load. In addition, the plant possesses advanced technology that can be used to reduce nitrogen oxide emissions. We believe that drawn-out Keystone XL process poses headlines risk that is currently depressing TRP’s valuation. On Monday, the Department of State restarted the national interest review on the Keystone XL projects. Despite these efforts, the White House is expected to veto the project and the House and Senate are not expected to reach the two-thirds super-majority needed to override the veto. We feel that current sentiments pose a buying opportunity for longer term investors given the company’s other prospects. We also think stakeholder agreements for Energy East would serve as a catalyst for TRP. In the most recent quarter, TransCanada filed for US government approval for the construction and operation of the Energy East Pipeline and terminal facilities with the National Energy Board. The firm is proposing a marine terminal near Cacouna, Quebec, which could impact the beluga whale population. We believe that a successful agreement regarding the impact on wildlife will likely be reached by quarter-end. In addition, we are pleased that the company completed a successful binding open season for the $600 million Upland Pipeline. The proposed pipeline would begin near the northwestern North Dakota oil hub of Williston and go north into Canada about 200 miles. It would transport up to 300,000 Bpd of oil, connecting with other pipelines including Energy East. We would also highlight TransCanada management’s statement that the decline in commodity prices have not had any impact on TRP’s cash flows. In terms of valuation, we believe that the highlighted growth projects combined with the capacity for over $1 billion in annual drop-downs to TC PipeLines, L.P. (NYSE: TCP ), should allow TRP to be re-rated to a 20x forward multiple, more in-lined with peers, Enbridge (NYSE: ENB ) and Fortis (OTCPK: FRTSF ). In the meantime, investors are paid a 3.6% dividend to wait for the projects to be developed. Disclosure: The author has no positions in any stocks mentioned, and no plans to initiate any positions within the next 72 hours. (More…) The author wrote this article themselves, and it expresses their own opinions. The author is not receiving compensation for it (other than from Seeking Alpha). The author has no business relationship with any company whose stock is mentioned in this article.
My ONEOK Fourth Quarter Earnings Prediction

I’m predicting revenues of $3 billion and an EPS number of $0.35. The average analyst estimate is calling for $3.61 billion in revenue and $0.36 on earnings. The precipitous drop in natural gas prices has me a little worried for the guys and that’s what made me a bit more pessimistic than usual. As earnings season continues we haven’t heard much from the utilities companies but we have an important one reporting early this coming week with Oneok (NYSE: OKE ). Oneok has been moving down precipitously with the price of natural gas and I’ve been buying along the way. I selected this stock for my portfolio of thirty back in August of 2014 because I felt it was one of the better growth stocks in the utilities industry at the time. With that said I’d like to make my prediction for Oneok for the fourth quarter of 2014 that the company will be announcing on February 23, 2015 after the market closes. ONEOK INC INCOME STATEMENT Fiscal year ends in December. USD in millions except per share data. 2014-12 2014-09 2014-06 2014-03 2013-12 2013-09 Revenue $3,005 $3,120 $3,067 $3,163 $4,140 $3,572 Cost of revenue $2,514 $2,583 $2,571 $2,653 $3,488 $3,011 Gross profit $491 $537 $495 $511 $652 $561 Operating expenses Operation and maintenance $148 $153 $153 $127 $236 $209 Depreciation and amortization $73 $75 $72 $67 $108 $94 Other operating expenses $18 $18 $19 $22 $13 $28 Total operating expenses $239 $246 $244 $217 $357 $331 Operating income $252 $291 $251 $294 $295 $230 Interest Expense $87 $86 $89 $95 $90 $82 Other income (expense) -$14 -$53 $29 $21 $35 $39 Income before income taxes $151 $152 $191 $220 $239 $187 Provision for income taxes $33 $38 $42 $15 $55 $39 Net income from continuing operations $118 $114 $149 $205 $184 $148 Net income from discontinuing ops $0 $0 -$8 $2     Other -$46 -$50 -$79 -$113 -$93 -$85 Net income $73 $64 $62 $94 $91 $62 Net income available to common shareholders $73 $64 $62 $94 $91 $62 Earnings per share Basic $0.35 $0.31 $0.29 $0.45 $0.44 $0.30 Diluted $0.35 $0.31 $0.29 $0.45 $0.43 $0.30 Weighted average shares outstanding Basic 208 209 209 209 206 206 Diluted 210 211 211 210 211 210 I have revenue coming in at $3 billion while the average analyst estimate for the quarter is $3.61 billion with a low of $2.88 billion. So I appear to be a bit pessimistic for the quarter on revenue than the average analyst. I guess I am a bit pessimistic because of the drop in natural gas prices over the past three months. On a GAAP basis I’m predicting earnings to be $0.35 while the average estimate is $0.36 with a low of $0.26. I’m actually a penny below estimates because I’m assuming great operating efficiencies to be realized during the quarter. We’ll have to wait and see what happens in a few days, but one thing is for sure, I have been buying the stock pretty much on a weekly basis since November because I believe it has been unjustly punished. The stock began to rebound at the middle of January and I hope that it can continue the move upwards from here on out. Disclaimer: This article is in no way a recommendation to buy or sell any stock mentioned. This article is meant to serve as a journal for myself as to the rationale of why I bought/sold this stock when I look back on it in the future. These are only my personal opinions and you should do your own homework. Only you are responsible for what you trade and happy investing! Disclosure: The author is long OKE. (More…) The author wrote this article themselves, and it expresses their own opinions. The author is not receiving compensation for it (other than from Seeking Alpha). The author has no business relationship with any company whose stock is mentioned in this article. Are you Bullish or Bearish on ? Bullish Bearish Neutral Results for ( ) Thanks for sharing your thoughts. Submit & View Results Skip to results » Share this article with a colleague

Do These 9 Stocks Represent Your Portfolio?

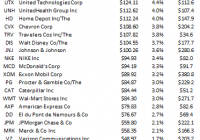
The oft referenced Dow closed at its all-time high on Friday. The Dow, which uses a price weighting methodology, might not be representative of your portfolio. Broadly diversified, capitalization-weighted indices should correlate more with a highly diversified portfolio. The Dow Jones Industrial Average (NYSEARCA: DIA ) closed at its all-time high on Friday of 18,144. This new record will be a talking point on the nightly news, and around the dinner table this weekend. My sister-in-law, knowing that I work in investment management, brought Dow 18,000 up to me in the last week. While it is very nice of her to engage me in conversation about one of my favorite topics – the financial markets – talk of the Dow to me is like nails on a chalkboard. Why? The Dow got its start in the late 1800s as a means of synthesizing the movements of industrial stocks into a single number. While its price-weighting and narrow coverage universe of thirty stocks are now anachronistic in the days of computerized calculations and alternative weightings, the Dow has retained its status as a stock market bellwether. To understand my aversion to references about the Dow, I have tabled the current thirty constituents with their market price, market capitalization, and index weight below: Source: Dow Jones, Bloomberg You will notice above that the index weights are based on the stock price. A company worth $100B could have a stock price worth $1 and 100 billion shares outstanding, or have a stock price worth $1B and one hundred shares outstanding. A company with a stock price of $1B would dominate a price-weighted index. Exxon Mobil (NYSE: XOM ) has the largest market capitalization of any of the index constituents, but has only the fifteenth largest weighting amongst the constituents. General Electric (NYSE: GE ) has the smallest weighting in the Dow despite having the fifth largest capitalization. Exxon is the second largest constituent amongst the five hundred companies that make up the S&P 500. General Electric is the seventh largest constituent in that index. In fact, the nine companies tabled below make up half of the weight of the Dow. Source: Dow Jones, Bloomberg In the capitalization-weighted S&P 500, these same nine companies make up just over six percent of the index. Source: Standard and Poor’s, Bloomberg Half of the daily movement in the Dow is going to be driven by just these nine companies. Those same companies are going to account for just six percent of the variability of the S&P 500 (NYSEARCA: SPY ). Despite its analytical shortcomings, the Dow is still an oft referenced benchmark. Unless your portfolio is heavily weighted to the largest Dow components and their relatively high share prices, it is probably a bad representation of your domestic equity exposure. I will have to send this article to my sister-in-law. Disclaimer: My articles may contain statements and projections that are forward-looking in nature, and therefore inherently subject to numerous risks, uncertainties and assumptions. While my articles focus on generating long-term risk-adjusted returns, investment decisions necessarily involve the risk of loss of principal. Individual investor circumstances vary significantly, and information gleaned from my articles should be applied to your own unique investment situation, objectives, risk tolerance, and investment horizon. Disclosure: The author is long SPY. (More…) The author wrote this article themselves, and it expresses their own opinions. The author is not receiving compensation for it (other than from Seeking Alpha). The author has no business relationship with any company whose stock is mentioned in this article.