Tag Archives: seeking-alpha

Technology ETF: XLK No. 3 Select Sector SPDR In 2014

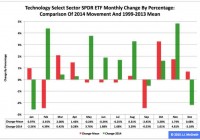
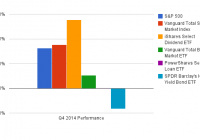
Summary The Technology exchange-traded fund finished third by return among the nine Select Sector SPDRs in 2014. As it did so, the ETF was weak at the beginning and the end of the year, while strong in the months in-between. Seasonality analysis of the first quarter is a mixed bag, but my data interpretation suggests a constrained return. The Technology Select Sector SPDR ETF (NYSEARCA: XLK ) in 2014 ranked No. 3 by return among the Select Sector SPDRs that cleave the S&P 500 into nine fragments. On an adjusted closing daily share-price basis, XLK climbed to $41.35 from $35.09, a hike of $6.26, or 17.84 percent. It thus behaved better than its parent proxy, the SPDR S&P 500 Trust ETF (NYSEARCA: SPY ) by 4.38 percentage points, but worse than its sibling, the Utilities Select Sector SPDR ETF (NYSEARCA: XLU ) by -10.90 points. (XLK closed at $41.25 Friday.) XLK ranked No. 7 among the sector SPDRs in the fourth quarter, when it lagged XLU and SPY by -9.00 and -0.72 percentage points, in that order. And XLK ranked No. 9 among the sector SPDRs in December, when it performed worse than XLU and SPY by -5.75 and -1.92 percentage points, respectively. Figure 1: XLK Monthly Change, 2014 Vs. 1999-2013 Mean (click to enlarge) Source: This J.J.’s Risky Business chart is based on analyses of adjusted closing monthly share prices at Yahoo Finance . XLK behaved a lot better in 2014 than it did during its initial 15 full years of existence based on the monthly means calculated by employing data associated with that historical time frame (Figure 1). The same data set shows the average year’s weakest quarter was the third, with an absolutely large negative return, and its strongest quarter was the fourth, with an absolutely large positive return. Inconsistent with this pattern, the ETF had excellent gains each and every quarter last year. Figure 2: XLK Monthly Change, 2014 Versus 1999-2013 Median (click to enlarge) Source: This J.J.’s Risky Business chart is based on analyses of adjusted closing monthly share prices at Yahoo Finance. XLK also performed a lot better in 2014 than it did during its initial 15 full years of existence based on the monthly medians calculated by using data associated with that historical time frame (Figure 2). The same data set shows the average year’s weakest quarter was the second, with a relatively small positive return, and its strongest quarter was the fourth, with an absolutely large positive return. Meanwhile, there is a big difference between the monthly mean and median performances of the ETF in Q1: Personally, I parse the relevant data more bearishly (consistent with the mean) and less bullishly (inconsistent with the median) in the current context. Figure 3: XLK’s Top 10 Holdings and P/E-G Ratios, Jan. 9 (click to enlarge) Note: The XLK holding-weight-by-percentage scale is on the left (green), and the company price/earnings-to-growth ratio scale is on the right (red). Source: This J.J.’s Risky Business chart is based on data at the XLK microsite and FinViz.com (both current as of Jan. 9). XLK appears poorly positioned to be a standout among the Select Sector SPDRs, either this quarter or this year, given factors discussed in “PowerShares QQQ’s 2014 And Fourth-Quarter Performance And Seasonality.” Basically, I anticipate one of the biggest headwinds buffeting the U.S. technology sector in general and XLK in particular over the foreseeable future may be the bias divergence in monetary policy at major central banks around the world. On the one hand, the U.S. Federal Reserve is oriented toward tightening; on the other hand, the Bank of Japan, European Central Bank and People’s Bank of China are oriented toward loosening. This divergence has had important effects on exchange rates, such as in the euro and U.S. dollar currency pair, or EUR/USD. It is worth mentioning in this context that the Fed announced the end of asset purchases under its latest quantitative-easing program, aka QE3+, Oct. 29 and may announce the beginning of interest-rate hikes April 29. Its conclusion of purchases under its first two formal QE programs this century is associated with both a correction and a bear market in large-capitalization equities, as evidenced by SPY’s declines of -17.19 percent in 2010 and -21.69 percent in 2011. The bias divergence at the major central banks has been reflected by action in the EUR/USD cross, which slipped from as high as $1.3992 May 8 to as low as $1.1753 Jan. 8, a slide of -$0.2239, or -16.00 percent, based on data at StockCharts.com. This change in EUR/USD and similar moves in other currency pairs indicate a strengthening greenback and a weakening everything else could pressure earnings of U.S. companies in sectors with substantial international businesses. And XLK encompasses many firms fitting this description, with its exposure to either the tech or the telecommunications sectors at about 100 percent, per its microsite. Meanwhile, the valuations of the ETF’s top 10 holdings seem unlikely to function as tailwinds for it this quarter (Figure 3). Nonetheless, the S&P 500 information-technology sector does not strike me as hideously overvalued, with S&P Senior Index Analyst Howard Silverblatt reporting Dec. 31 its P/E-G ratio was 1.20. Of course, it was a different story with the index’s telecommunications-services sector, with Silverblatt reporting at the same time its P/E-G ratio was 2.16. Disclaimer: The opinions expressed herein by the author do not constitute an investment recommendation, and they are unsuitable for employment in the making of investment decisions. The opinions expressed herein address only certain aspects of potential investment in any securities and cannot substitute for comprehensive investment analysis. The opinions expressed herein are based on an incomplete set of information, illustrative in nature, and limited in scope. In addition, the opinions expressed herein reflect the author’s best judgment as of the date of publication, and they are subject to change without notice.

The 5 Funds – Q4 2014 Portfolio Review

Summary Reviews the performance of The 5 Funds Portfolios. The Vanguard REIT Index was the top performing ETF in the portfolios last quarter. Junk Bonds and International ETFs were the worst performers. Each quarter I plan to update my 3 portfolios: The Aggressive 5, The Moderate 5, and The Conservative 5 and show the performance from the previous quarter, as well as since inception. I’ll also give an update on why I’m making some of the changes and my quick market update. Hopefully this will be helpful for people either following my portfolios or creating their own ETF portfolio. The Conservative 5 Name Symbol Type Allocation Change Vanguard Total Stock Market Index ETF (NYSEARCA: VTI ) Large Cap Blend 25% +5% 1 iShares Select Dividend ETF (NYSEARCA: DVY ) Mid-Cap Value 16% +1% 3 Vanguard Total Bond Market ETF (NYSEARCA: BND ) Intermediate Term Bond Fund 35% None PowerShares Senior Loan ETF (NYSEARCA: BKLN ) Short Term Bond Fund 0% -10% 2 SPDR Barclay’s High Yield Bond ETF (NYSEARCA: JNK ) High Yield Bond Fund 9% -1% 3 iShares Floating Rate Bond (NYSEARCA: FLOT ) Short Term Bond Fund 10% +10% 1 Cash Cash 5% -5% 2 Updated 1/4/2015 Add Allocation Reduce Allocation Investment Drift (No New Trades Required) Conservative 5 Performance* Conservative 5 SPY (S&P 500) Last Month -0.6% -0.3% QTD 2.0% 4.9% YTD – – Since Inception (10/1/2014) 2.0% 4.9% Std Dev. compared to SPY .31 1.0 As of 12/31/2014 Performance by ETF January 2015 Update The biggest update to the Conservative 5 Portfolio ​is the removal of PowerShares Senior Loan ETF and replacing it with the iShares Floating Rate Bond. The reason for the change is that I’m concerned with the amount of volatility in BKLN. As we saw, it took a few large dips in the 4th quarter of 2014. BKLN consists of a lot of lower quality bonds which is the reason for the volatility, FLOT is a more conservative, less volatile ETF which allows us to increase our position in VTI without adding much additional volatility to the portfolio. We continue to favor equities over bonds in 2015 and feel as rates rise and bonds are hurt, the equity market should outperform. We have also reduced the cash position in the account to 5% and moved that money over to Vanguard Total Stock Market Index. This move will add slightly more risk to the portfolio, but the overall risk of the portfolio should not be increasing significantly. The Moderate 5 Name Symbol Type Allocation Change Vanguard Total Stock Market Index ETF VTI Large Cap Blend 60% +5% 1 Vanguard FTSE Developed Markets ETF (NYSEARCA: VEA ) Large Cap International 5% -5% 2 Vanguard FTSE Emerging Markets ETF (NYSEARCA: VWO ) Emerging Markets 0% -5% 2 Vanguard Total Bond Market ETF BND Intermediate Bond 20% None Vanguard REIT ETF (NYSEARCA: VNQ ) REIT 5% None PowerShares QQQ ETF (NASDAQ: QQQ ) Large Cap Growth 5% +5% 1 Cash Cash 5% None Updated 1/4/2015 Add Allocation Reduce Allocation Investment Drift (No New Trades Required) Moderate 5 Performance* Moderate 5 SPY (S&P 500) Last Month -1.1% -0.3% QTD 3.3% 4.90 YTD – – Since Inception 3.3% 4.9% Std. Dev compared to SPY .63 1.0 ​ As of 12/31/2014 Performance by ETF January 2015 Update We made 2 fairly large updates to The Moderate 5 portfolio during this reallocation, both of which focused on reducing our international exposure and increasing U.S. exposure. We have seen emerging markets really struggle lately because of the rising dollar and many EM countries, like Russia, are oil exporters, so the lower oil prices have weighed on their economy. We have replaced our Emerging Markets ETF with QQQ, which is a technology themed U.S. growth ETF. We believe that the tech sector will continue to grow in 2015 and this should be a good compliment to the Vanguard Total Stock Market ETF already in the portfolio. We also reduced the Vanguard FTSE Developed Markets ETF because we are still concerned with international exposure and would prefer to have that money in the U.S. for now. That being said, we are keeping a close eye on Europe and Japan as we think both could do well this year. Don’t be surprised if we add back to our international position later in the year as Europe, Japan, and even China have promised to keep interest rates low and money pumping into these economies as the U.S. looks to rise rates as QE is now completed. The Aggressive 5 Name Symbol Type Allocation Change Vanguard Total Stock Market Index ETF VTI Large Cap Blend 66% +1% 3 Vanguard FTSE Developed Markets ETF VEA Large Cap International 9% -1% 3 Vanguard FTSE Emerging Markets ETF VWO Emerging Markets 0% -5% 2 PowerShares QQQ ETF QQQ Large Cap Growth 10% None Vanguard REIT ETF VNQ REIT 5% None iShares Russell 2000 (NYSEARCA: IWM ) Small Cap Blend 5% +5% 1 Cash Cash 5% None Updated 1/4/2015 Add Allocation Reduce Allocation Investment Drift (No New Trades Required) Aggressive 5 Performance* Aggressive 5 SPY (S&P 500) Last Month -1.3% -0.3% QTD 4.2% 4.9% YTD – – Since Inception (10/1/2014) 4.2% 4.9% Std. Dev compared to SPY .92 1.0 Performance by ETF January 2015 Update Only 1 large change this quarter to The Aggressive 5 Portfolio which focuses on reducing our international exposure and increasing U.S. exposure. We have seen emerging markets really struggle lately because of the rising dollar and many EM countries, like Russia, are oil exporters, so the lower oil prices have weighed on their economy. We have replaced our Emerging Markets ETF with iShares Russell 2000 Index. We saw small cap companies struggle in 2014 and think that they could rebound in 2015 now that their valuations are more attractive than where they were a year ago. We believe 2015 will be a good year for the market and typically small company stocks outperform the S&P 500 in that type of environment. We didn’t make a change to the Vanguard FTSE Developed Markets ETF, but the allocation percentage dipped by 1% because of their under performance over the past quarter. As discussed above, we are keeping a close eye on Europe, Japan, and even China, as we think these economies could do well this year. *Performance is measure by Morningstar and assumes no trade commissions. Assumes trades were placed on 10/1/14 at the closing price on that day.

3 New Nontraditional Bond Funds Hit The Market

By DailyAlts Staff As fixed-income investors face asymmetrical interest-rate risk and other headwinds in 2015, nontraditional bond funds are looking more and more attractive. Such funds are often referred to as “go anywhere” funds, since they’re allowed to “go anywhere” in pursuit of their investment objectives. Three such funds were launched in the final month of 2014, as outlined below: Counterpoint Tactical Income As a new entrant into the liquid alternatives field, Counterpoint Mutual Funds launched its first mutual fund last month, the Counterpoint Tactical Income Fund. The fund has a focus on investing in high yield securities (including bonds, bank loans, floating rate bonds and debt and municipal high yield debt), but doing so when the firm’s algorithms identify trends that point to a risk-on environment. In risk-off environments, as identified by the firm’s trend-following algorithm, the fund will be allocated to less risky assets such as U.S. Treasuries and cash. The fund also has the ability to invest in derivatives to hedge against credit and interest rate exposure. The fund will pursue its tactical-income strategy by investing in mutual funds, closed-end funds, and ETFs, but also has the ability to invest directly in individual securities directly. In addition, the fund is permitted to use up to 33 1/3% leverage to pursue its objective of income and capital preservation. The fund is managed by the firm’s two founders, Michael Krause and John Koudsi, and carries a relatively high management fee of 1.25%. The fund is available in three share classes: A (MUTF: CPATX ), C (MUTF: CPCTX ), and I (MUTF: CPITX ); with respective net-expense ratios of 2.60%, 3.35%, and 2.35%. This compares to an average expense ratio of 1.30% for Morningstar’s Nontraditional Bond category. The minimum investment for A- and C-class shares is $5,000; while the minimum required for I-class shares is $100,000. For more information, download a pdf copy of the fund’s prospectus . Transamerica Unconstrained The Transamerica Unconstrained Bond Fund (ticker: TUNAX ) was launched on December 5, and like other Transamerica funds, this fund’s investment management is outsourced to an external sub-advisor. In this case, the fund’s sub-advisor is PineBridge Investments , which also manages the Transamerica Inflation Opportunities Fund (ticker: TIOAX ). The fund’s objective is to maximize returns through a combination of interest income and capital appreciation. PineBridge pursues this objective by employing an “unconstrained” style, taking long and short positions in debt instruments across sectors, geographies, capitalizations, and credit grades. PineBridge’s investment decisions are based on macroeconomic analysis that determines asset allocations, as well as specific investments within those allocations. The fund’s duration is expected to generally stay in the range of -3 years to +10 years. The fund is available in A- (TUNAX), C- (MUTF: TUNBX ), and I-class (MUTF: TUNIX ) shares, with a management fee of 0.64% and a relatively low net-expense ratios of 1.14%, 1.89%, and 0.89%, respectively. The minimum investment for A- and C-class shares is $1,000; while the minimum for I-class shares is $1 million. For more information, read the fund’s prospectus . Sentinel Unconstrained Finally, the Sentinel Unconstrained Bond Fund launched on December 23. The fund has the latitude to invest in U.S. and non-U.S. fixed income securities of any credit quality, can use shorting and derivatives and will maintain its duration in the range of -5 years to +10 years. The fund can also hold up to 20% in equity securities. Jason Doiron, portfolio manager and Head of Investments with Sentinel, will be the fund’s portfolio manager. The fund’s shares are available in A- (MUTF: SUBAX ), C- (MUTF: SUBCX ), and I-class (MUTF: SUBIX ) shares; with a 0.75% management fee and respective net-expense ratios of 1.56%, 3.56%, and 1.14%. Like the Transamerica Unconstrained Bond Fund, the minimum investment for A- and C-class shares is $1,000; while the minimum for the institutional I-class shares is $1 million. For more information, read the fund’s prospectus .