Tag Archives: seeking-alpha

Update On American Express And Investing Tips

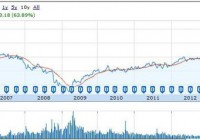
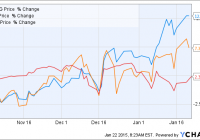
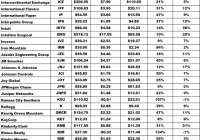
American Express is down $10 a share from our entry price. Nevertheless we are staying the course and holding this stock long term. We will not be shorting stocks in our 1% portfolio. There are many more “long” millionaires than “short.” Our new position, BND, is performing well. It will be a good anchor for our portfolio as its volatility seems to be very low. So finally the ECB has decided to resort to quantitative easing like the U.S. It actually is going to spend 60 billion euros a month instead of the 50 billion figure leaked yesterday. Will it work? Has quantitative easing worked in the U.S.? The bulls would say yes with 5% GDP and low unemployment. The bears would say no with trillions of extra debt and an upcoming dollar crisis. I’m with the bears on this one. All throughout history printing money has always lead to inflation and a weak currency. Would you prefer to live in Switzerland where the Swiss central bank has decided to stop printing money (finally) or Spain where the ECB is going to print 720 billion euro this year alone? The “unintended consequences” will soon start to emerge as all fiat currencies will begin to lose substantial purchasing power. At this inflection point, the public will rush into hard assets such as Gold and Silver. Our portfolio is doing well with now close to $400k invested. I want to touch on American Express Company (NYSE: AXP ) as a follower asked me about its validity going forward. We bought the stock at $94 and currently the stock is trading at around $84 a share. Also the portfolio received a dividend payment of $69 last week. The stock is selling off today due to earnings that were announced in the last 24 hours. Furthermore the company announced recently that it is cutting at least 4000 jobs. Irrespective of the negativity surrounding American Express lately, we are not selling our position. Yes the dividend yield is low at 1.2% but the company has committed to increased dividends and subsequently has increased its dividend for the last three years. However there are many more reasons to hold this stock long term. First of all it dominates its industry and when a company has this much market share, it recovers from recessions quicker than other companies ( see its recovery in the chart below since 2008). The company is still well-priced at these levels and its market cap just continues to grow over time. Have the courage to hold it. In the long term it will do very well. We as fundamental investors who will continue to collect dividends and option premium and wait for the stock price to recover. (click to enlarge) The follower is fearful the stock may drop ( and it may do – in the short term). As investors we need to invest with the end goal in mind. We can’t be taken off course just because of sharp movements in our underlyings. We stay the course and we stick to our plan. Fear also exists on the way up. One such example is the gold market. Long term gold investors are long and will stay long for the long haul. Gold is up 10% already this year. Do these long investors sell and take their profits? No way. These gold bulls are in it for the long haul and that’s how the big profits are made. In one way, holding physical gold is better than holding an ETF or stock. You can’t sell your asset as easily as you can sell an ETF that tracks the Gold price like the SPDR Gold Trust ETF (NYSEARCA: GLD ). Here lack of liquidity is an advantage. Therefore If you believe in your investment, have the courage to hold it through thick and thin. Be prepared to “ride the bull” as that’s where the big profits are in a healthy bull market. Shorting stocks or ETFs also wont happen in this portfolio. There are many distinct disadvantages when shorting underlyings in your portfolio. You are borrowing shares from your broker. You do not have 100% control and sometimes your broker will “call away” your shares at very short notice because the lender wants his stock back. This happens especially when many investors are shorting the same stock. Losses can be infinite (multiple times your initial trade). You need a margin account to short so you pay monthly interest on your bet. Finally I mentioned the other day that the portfolio bought the Vanguard Total Bond Market ETF (NYSEARCA: BND ). I must say that I like its action. Its going to be a good anchor for this portfolio (at least in the short term until the bond trend changes). This ETF tracks 3000 U.S. bonds (all types) and has a 2% annual yield. What’s interesting today is that the iShares 20+ Year Treasury Bond ETF (NYSEARCA: TLT ) and the iShares 7-10 Year Treasury Bond ETF (NYSEARCA: IEF ) are down but our ETF is unchanged. I believe this is the best place to be in the bond sector but we will be watching closely for a trend change and at that point we will put more capital to work in this sector. Automatic profits were taken on positions in McDonald’s Corporation (NYSE: MCD ) and IBM (NYSE: IBM ) this week and new positions were opened (see the screen shot below). (click to enlarge) Current Balances – Making Progress – Slow & Steady wins the race. Now that you’ve read this, are you Bullish or Bearish on ? Bullish Bearish Sentiment on ( ) Thanks for sharing your thoughts. Why are you ? Submit & View Results Skip to results » Share this article with a colleague

A New Biotech ETF Looks To Bring The Genomic Revolution To Investors

Summary The ARK Genomic Revolution Multi-Sector ETF launched last year with the goal of investing in companies that develop technologies related to extending and enhancing the quality of human life. The fund typically invests in about 40-50 names and is currently divided almost equally among all market capitalizations. The fund’s 0.95% expense ratio is currently the highest of the biotechnology ETFs. With biotechnology continuing to be the hot sector heading into 2015, we’ve seen several investment firms looking to capitalize on the trend. I’ve profiled a pair of those new biotech ETFs launched just recently here and here and another new one targeting a specific niche of the biotech universe began trading at the end of October of last year. The ARK Genomic Revolution Multi-Sector ETF (NYSEARCA: ARKG ) is from ARK Capital Management. Its primary investment objective according to the fund’s fact sheet is to identify securities that “are substantially focused on and are expected to substantially benefit from extending and enhancing the quality of human and other life by incorporating technological and scientific developments, improvements and advancements in genomics into their business. One such way this is accomplished is by offering new products or services that rely on genomic sequencing, analysis, synthesis or instrumentation.” This ETF typically invests in about 40-50 companies and isn’t necessarily looking for the next big diamond in the rough. According to the ARK Management website (which happens to update the holdings of this fund on a daily basis), the median market cap of one of its holdings is $5B. Illumina (NASDAQ: ILMN ) – the company that develops and manufactures tools for the analysis of gene sequencing – is the ETF’s current top holding but other big positions include popular names like Monsanto (NYSE: MON ), Biogen (NASDAQ: BIIB ) and even Qualcomm (NASDAQ: QCOM ). The fund doesn’t necessarily come cheap though. Its 1.45% expense ratio is currently the highest in the biotechnology ETF space easily outpacing the category average of 0.48% and the SPDR S&P 500 ETF (NYSEARCA: SPY ) ratio of just 0.09%. Management is currently capping the expense rate at its current management fee of 0.95% (administrative expenses of 0.50% are currently being waived although it’s still the highest in the sector). That’s not entirely unexpected as new funds establishing their portfolios for the first time tend to be more inefficient until the level of assets under management (currently at around $5M for this ETF currently) increases. Thanks to the continued popularity of biotechs the fund has gotten off to a fast start. Since its inception, the fund is up 13%. That’s well ahead of the iShares NASDAQ Biotechnology ETF (NASDAQ: IBB ) return of 7% and the S&P 500 return of 2%. ARKG data by YCharts Conclusion With biotechs in favor right now it’s not surprising to see niche ETFs like this popping up. The top holdings of this fund are actually fairly different from those of the Biotech Index ETF so it looks like there is some diversification potential here. The fund is off to a good start and the active management of the portfolio is a differentiator but it comes at a cost. The current expense ratio is a bit prohibitive and should be monitored to see if it comes in line with the sector average over time. Overall, investors looking for biotech exposure should consider this ETF for their portfolios. Now that you’ve read this, are you Bullish or Bearish on ? Bullish Bearish Sentiment on ( ) Thanks for sharing your thoughts. Why are you ? Submit & View Results Skip to results » Share this article with a colleague

SPDR S&P 500 ETF (SPY) Analysis: Using CapFlow And FROIC

Summary Analysis of the components of the SPDR S&P 500 ETF (SPY) using my CapFlow and FROIC ratios. Specifically written to assist those Seeking Alpha readers who are using my free cash flow system. Part II will concentrate on “Main Street” while Part I in the series concentrated on “Wall Street”. Back in late December I introduced my free cash flow system here on Seeking Alpha, through a series of articles that you can view by going to my SA profile . My purpose in doing so was to try and teach as many investors as I could on how to do this simple analysis on their own as I believe in the following: “Give a person a fish and you feed them for a day, Teach a person to fish and you feed them for life” I have been very pleased with the positive feedback that I have received so far, but included in that feedback were many requests by those using my system, to see if they did their analysis correctly or not. Since the rate of these requests have been increasing with every new article I write, I have decided to start a new series of articles here on Seeking Alpha analyzing the SPDR S&P 500 ETF (NYSEARCA: SPY ), where I will analyze each of its components individually. That way those of you using my system will have something like a “teacher’s edition” that will give you all the correct calculations for each component. Obviously I can’t include the results for all my ratios in one article, so I will thus be doing a series of articles, where each ratio’s results for the SPDR S&P 500 ETF will have its own article devoted to it. Hopefully these articles can be used as reference guides that everyone can use over and over again, whenever the need arises. Having said that, I would suggest that everyone first read Part I by going HERE . There you will find the data on my “Free Cash Flow Yield” ratio which is one of three parts that I use it tabulating my final “Scorecard”. While free cash flow yield is a Wall Street ratio (Valuation Ratio), this article with concentrate on my “CapFlow” and “FROIC” Ratios, which are Main Street ratios. The final Scorecard results will be available in Part III of this series and basically combines all three ratio results to generate one final result. Once completed, my scorecard should give everyone a clearer understanding on how accurate the valuation is that Wall Street has assigned each company relative to its actual Main Street performance. Before we show you the final results of our two Main Street ratios, here is brief introduction to what each of the two ratios, which make up my system as well as what the final “Scorecard” score mean. CapFlow CapFlow is the name I have given to the ratio (Capital Expenditures/Cash Flow). CapFlow allows us to see how much capital spending (or capital expenditures, CAPEX) a company must employ in relation to its cash flow to maintain itself and more importantly grow the company. This ratio is extremely useful as it is both a qualitative and quantitative ratio in that it acts as a laser beam into the inner workings of a company. Quite simply if a company is increasing its profits and doing so by spending less money relative to its growth in cash flow, it should, in theory, outperform on Main Street. When you can have such an occurrence for more than a few years in a row, it clearly shows you have wonderful management in place that knows what it is doing. The ideal again is to consistently have a CapFlow of less than 33% and avoid any company, like the plague, that has a CapFlow of over 100%, as in such a case management is spending more in capital expenditures than it is bringing in from cash flow from operations. That is a recipe for disaster in my opinion. Just using this ratio alone will narrow your list of potential candidates for investment substantially and will give you an easy-to-use tool for judging management effectiveness. FROIC FROIC = Free Cash Flow Return on Invested Capital FROIC= Free cash flow/ (long-term debt + shareholders equity) FROIC basically tells us how much return in free cash flow a company generates for every one dollar of “Total Capital” it employs. I consider FROIC the primary determining factor in identifying growth companies as one can compare every company on an equal basis using this ratio. The question I ask every company I analyze is: “How much return (in percent) in free cash flow are you going to give us for every dollar of total capital you invest?” A FROIC of 20% or more is considered excellent and the higher the result the better. Since long-term debt is included in the invested capital part of the equation, one can see quite clearly by using this ratio, on just how well or how poorly management is managing its debt. So without further ado here are my results for the CapFlow and FROIC ratios for the components that make up the SPDR S&P 500 ETF : Always remember that the results shown above are just for two ratios and that this is not investment advice, but just the results of the ratios. The system outlined in this article and all that will follow, as part of this series, are just meant to be used as reference material to be included as just “one” part of everyone’s own due diligence. So in other words, don’t make investment decisions based on just these two results, but incorporate them as part of your own due diligence.