Tag Archives: seeking-alpha

Will Monetary Policy Bring Further Down Oil Prices?

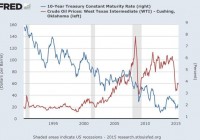
Summary The price of USO remained around $20 over the past month. The FOMC could start raising rates soon. Will it bring down oil prices? The potential rise in OPEC’s production could keep pressuring down shares of USO. The recovery in the oil market has cooled down as the price of WTI oil is around $60 – it hasn’t moved from this level the past month – and the United States Oil ETF (NYSEARCA: USO ) remained around $20. Besides the changes in supply and demand, which are the main factors shifting the fundamental conditions of the oil market, monetary policy also plays a role in the movement of oil prices. Let’s take a closer look at this issue and its potential impact on the oil market and the price of USO. Are interest rates going up? So far, the answer isn’t clear cut. Interest rates have gone up in recent weeks, but they are actually lower than where they were a year ago. For now, the market is still uncertain whether the Federal Reserve will raise rates this year and the pace of the subsequent rate hikes. And even if it does raise rates, how high can they go? Despite the high uncertainty, the current expectations are for the FOMC to start raising rates this year – in one scenario, the FOMC could start in September and bring the cash rate to 0.5% by the end of the year. But will higher interest rates push down oil prices? If interest rates were to start climbing up again, they may have some repercussions on oil prices. The effect of higher interest rates has been studied and here is one source that summarizes the intuitions and the factors that come into play in bringing oil prices down when rates go up. But, as you can see below, for oil prices to reach low levels – say falling below $40 – interest rates will have to climb back up to the high levels they were back in the 90s, when 10-year treasury rates were around 5%-7%. And the current oil market isn’t the same as it was back in the 90s or early 2000s. In any case, since rates are expected to remain very low this year and next, the main impact could come from the change in market expectations about where rates are heading once the FOMC starts to raise rates. (click to enlarge) Source of chart taken from FRED The chart also suggests, at face value, that there isn’t a strong relation between interest rates and oil prices. So, the basic intuition for the relevance of monetary policy in the context of oil prices is only one among many factors moving oil prices. The changes in supply and demand will likely be leading the way in impacting oil. When it comes to supply, OPEC is still adamant at keeping its quota of 30 million barrels per day, which has exceeded this level in the past few months. Even though Iran’s deal with the U.S. isn’t in place, the country is already preparing to ramp up production in the next couple of years – this could make it harder for OPEC to keep its 30 million barrels per day without someone else among the OPEC members reducing their market share. Thus, we should expect OPEC to de facto produce more than 30 million barrels per day. For the short term, however, oil prices could start to come down as the market adjusts its expectations regarding a possible rate hike by the FOMC and more importantly the change in policy that could lead to even higher rates down the line (albeit it could take a while before rates reach high levels, perhaps even years). The FOMC could shed some light on the timing of the rate hike or at least show if a rate hike is on the table in the coming months. For the USO investors, the price could take another beating as the market adjusts its expectations and rates start to climb back again. Thus, USO could also suffer from the changes in market expectations about the direction of interest rates. Even though the changes in demand and supply will trump up any changes in monetary policy, the potential rise in oil production by OPEC along with the stable oil output in the U.S. could start pressuring back down oil prices, at least for the short run. (For more please see: ” USO Investors – Beware of The Contango! “) Disclosure: The author has no positions in any stocks mentioned, and no plans to initiate any positions within the next 72 hours. (More…) The author wrote this article themselves, and it expresses their own opinions. The author is not receiving compensation for it (other than from Seeking Alpha). The author has no business relationship with any company whose stock is mentioned in this article.

Profit From The Stock Market’s Newest Red-Hot Tech Sector

The “Internet of Everything” offers incalculable benefits as millions of devices become connected across the planet. At the same time, the explosion in connectedness has introduced the world to a new word in our vocabulary – “cybercrime.” Ironically, this also offers traders and investors one of the most exciting investment opportunities in an otherwise flatlining U.S. stock market. Over the past year, cybercrime has become a staple of the evening news. In October of 2014, the breaches of the databases of The Home Depot (NYSE: HD ), JPMorgan Chase (NYSE: JPM ) and Target (NYSE: TGT ) resulted in the compromised security of 56 million credit cards, 76 million households, seven million small businesses and 110 million accounts. Last month, the IRS announced that the identities of 2.7 million taxpayers were hacked last year. Last week, the government revealed that hackers stole personnel data and Social Security numbers for every federal staffer, past and present. According Symantec’s annual Internet Security Threat report, cyber attacks and cybercrime against large companies – those with over 2,500 employees – rose 40% globally in 2014. Attacks on small and medium-sized companies, which accounted for 60% of targeted attacks, increased 26% and 30%, respectively. And as the world becomes ever more interconnected through ever-expanding computerized networks, the frequency and scale of cyber attacks are likely to increase. By 2020, Gartner estimates that there will be over 26 billion Internet-connected devices, 250 million Internet-connected automobiles and a $50-billion market for surveillance. And as mobile payment technologies like Apple (NASDAQ: AAPL ) Pay and Google (NASDAQ: GOOG ) Wallet take off, mobile devices will become more prominent victims of cyberattacks. The Eye-Popping Costs of Cybercrime The costs of cybercrime are already huge. The Home Depot estimated that investigation, credit monitoring, call center and other costs of its breach last year could top $62 million. Target estimates that its breach-related expenses hit an eye-popping $146 million. That’s a lot of money. No wonder an estimated 60% of all companies experiencing a cybersecurity breach go out of business within six months of suffering an attack. Overall, cybercrime costs the globe over $400 billion per year. That’s more than the annual gross domestic product (GDP) of the Philippines, a country of 100 million people. And cyber attacks are about more than just losing money. Attacks can potentially shut down or manipulate a country’s energy infrastructure, weapons defense systems, medical devices and transportation systems. Russia launched the first cyber war against tiny Estonia in 2007. The president of Stanford University told me two years ago that the Silicon Valley-based university was being attacked dozens of times a day, with most of the attacks coming from China. How to Profit from the Cybersecurity Boom Cybersecurity companies claim they can stop more than 99% of cyber attacks from happening. And defense against cyber attacks is becoming a very big business. Gartner estimates cybersecurity spending topped $71 billion worldwide last year. FBR Capital Markets predicts a global 20% increase in spending in 2015. This year’s spending, in turn, could double to more than $155 billion by 2019. Of course, picking the long-term winners within the dynamic and ever-changing cybersecurity sector is a challenge. That said, savvy investors know that the pattern for making money in any new sector is similar, whether it’s automobiles in the early 1990s or the Internet in 1999. Stage one involves a general run-up in the sector across a wide range of players. Stage two is a painful period of consolidation. In the end, there will be a handful of winners. If you are holding one of them, you will make a fortune. But if you bet on one of the losers, you can lose a lot of money. As I recently recommended to my Alpha Investor Letter subscribers, the PureFunds ISE Cyber Security ETF (NYSEARCA: HACK ) – a broad-based bet on the cybersecurity investment theme – is one way around this. HACK tracks the ISE Cyber Security Index, investing in 31 stocks across the planet, each focused on software systems and other solutions that defend against cyberattacks. HACK’s top three holdings include Cyberark Software Ltd. (NASDAQ: CYBR ), 6.09%; Fireeye Inc. (NASDAQ: FEYE ), 5.96%; and Infoblox Inc. (NYSE: BLOX ), 5.14%. The fund invests 49.35% of its portfolio in the top 10 holdings. This means that the risk in the fund is quite concentrated. And, as a result, it is quite volatile. HACK has outperformed both the S&P 500 and the NASDAQ 100 – by more than 27% and 23% over the past 12 months, respectively. HACK itself is up 22.54% this year. (click to enlarge) Still, most of today’s biggest opportunities in cybersecurity lie in next-generation solutions, including cloud security and big data security analytics. It is these cyber startups that are providing the most innovative solutions, and many are doubling and tripling revenues annually. That’s why cybersecurity is a sector best suited for short-term traders skilled at playing both the long and short side of highly volatile individual stocks. But whether you’re a long-term investor or short-term trader, just realize that the cybersecurity rocket ship has taken off. So strap yourself in for the ride.

Myths And Reality Of Market Timing (And A Solution)

Summary 4 myths about market timing debunked. Why no usual market timing indicator is reliable. What is a systemic indicator, an example and a solution. Market Timing has two points in common with global warming. The first one is that it lets nobody indifferent. Either you believe it, or you discard it. The second one is that some people have a big interest in convincing the public that it’s a children’s tale. Whatever your opinion, there are harmful myths about market timing. Make sure that your savings don’t become victim of one of them. Myth #1: Timing the market means calling the market tops and bottoms. Reality: Timing the market is detecting when the unpredictable becomes more likely. Those who have knowledge, don’t predict. Those who predict, don’t have knowledge. – Lao-Tzu Market timing is not about making predictions, but telling when the ecosystem is favorable to black swans. Myth #2: Timing the market means improving the return Reality: Timing the market aims at protecting the capital. It’s not how much money you make, but how much money you keep. – Robert Kiyosaki The next table shows the difference between holding permanently SPY and following a timing indicator based on short interest (details on it in this article ) between 01/01/2001 and 05/10/2015.   Annualized return Max Drawdown Volatility (standard deviation) SPY (buy-and-hold) 5.5% -55.4% 19.7% SPY (timed on short interest) 6.3% -20.2% 10.3% The overhead in return doesn’t look great (0.8% annualized), but the risk reduction is impressive, measured in drawdown and volatility. An economic crisis may go from bad to worse if it causes a personal or professional crisis. Millions of people lost their jobs or businesses in the latest recessions. Dipping in savings for a badly needed amount of money is painful at a 20% drawdown, at a 55% drawdown it may wipe out a retirement plan. Even if you believe that the stock market will always recover, market timing reduces the risk of starting again from scratch. Myth #3: Timing the market means finding a good indicator. Reality: No single indicator is good enough to bet your savings on it. Confidence is what you have before you understand the problem – Woody Allen The United States has crossed 22 recessions since 1900 and 49 since 1785. If we consider that data to test usual market timing indicators are available for about a century (in the best cases), the sample is too small to claim that one timing indicator is better than another. Backtests are useful to compare strategies with several hundreds of trades. With so few data points, they are just a complement to common sense in listing possibly relevant variables. Further conclusions and optimized indicators are “fooled by randomness.” Myth #4: Timing the market means selling stocks and going to cash, bonds, gold (delete as appropriate) Reality: Keeping your stocks with a hedge is safer. We will continue to ignore political and economic forecasts, which are an expensive distraction for many investors and businessmen. – Warren Buffett What you think to be safe might not be. Gold price fell with stocks in 2008. Bonds and stocks may also fall simultaneously. It happened 3 times since 1928 on an annual basis: in 1931 (S&P 500 -43.84%, 10-year Treasuries -2.56%), 1941 (S&P 500 -12.77%, 10-year Treasuries -2.02%), 1969 (S&P 500 -8.24%, 10-year Treasuries -5.01%). It happened more often on a quarterly basis (14 times since 1977, the worst in Q3 1981: S&P 500 -10.29%, Barclay’s aggregate bond index -4.07%). A “bipolar” bear market is quite probable in a rising rate environment. The recent MF Global case is a warning that keeping cash in a trading account is not safe either. Customers’ cash has spent 2 years in the limbos, and the outcome may be worse next time a broker files for bankruptcy. With a diversified portfolio based on valuation or dividend, the safest option is likely to continue with the same strategy, unchanged except adding a hedge to put the portfolio in market-neutral mode . Doing so, no assumption is made about inter-market negative correlations. You just bet that your stock picks as a group will float better than the average, and you continue to cash dividends when there are dividends. A note of caution: this is not true if your portfolio is based on momentum. When a market downturn is likely to happen, momentum stocks are dangerous even in a market-neutral portfolio . Solution: a systemic indicator If you spend more than 13 minutes analyzing economic and market forecasts, you’ve wasted 10 minutes – Peter Lynch The first step to a solution is admitting that no determinist or probabilistic model is accurate to explain human group behaviors. Science applied to group psychology looks very much like pseudo-science. It doesn’t mean that scientific knowledge is useless, but we have to relativize it when used in complex systems with empirical purposes. Readers interested in how approaching complexity may have a look at a research field known as Systems Theory initiated many decades ago by the biologist Ludwig von Bertalanffy . Predicting events in particle physics and casino games is complicated yet possible (at least in terms of probabilities), whereas markets are complex. The difference is that the system cannot be explained starting from its parts. Techniques created in another field have at best a limited validity. One of the best attempts (publicly known) of a systemic timing indicator is the US Recession Probabilities by M. Chauvet and J. Piger: Chart from stlouisfed.org (click to enlarge) It looks good for economists, but I see 3 drawbacks in using this index for investing purposes: It uses only 4 economic variables, none of them taking into account the stock market dynamics and valuation. It gives an illusion of continuity. I think that risk states are discrete with sudden gaps. It is updated only once a month. I created and use another one: MTS10 is a composite market-timing indicator aggregating 10 variables in the 4 main categories of market analysis: sentiment, economy, fundamentals, and technicals. It is focused on a long-term investing horizon, based on research and consensus, without curve-fitting (more details here ). The value of MTS10 is an integer between 0 and 10. The value is updated once a week. The alarm level (7 and above) triggers a market-neutral state for my stock strategies. When the value is below 7, the hedge may be proportional to MTS10 or fixed between 0 and 100% depending on the strategy and the risk currently tolerated. The next chart shows MTS10 since 2001 in blue and the S&P 500 index in red. The green lines are the alarm level (horizontal) and the signals when it is crossed. This chart was plotted last week, with MTS10 at 5 (a 6-year high). The value has changed this week. The risk is not necessarily in proportion with the MTS10 value, but obviously, a higher value means a shorter way to the alarm level. The next charts shows a simulation of holding SPY only when MTS10