Tag Archives: seeking-alpha

Momentum In High Yield Has Shifted: Buy Some Protection

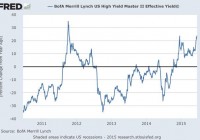
Summary Since bottoming on May 27, junk bond yields have begun steadily rising again. Corporate profits indicate that yields will continue to rise. With default risk increasing, buy credit protection for high upside. Starting around the latter half of 2014, one of the major changes to take hold in the market (besides the rise of the dollar index and collapse in oil prices) has been with bond yields. Junk bond yields have been rising substantially and quickly over the past few months. Much of the change has been due to oil prices, but another cause has been the weakening of corporate profits starting in 2014. With the trend continuing strong through the first half of 2015, there is still time to buy protection against rising yields. As profits fall and oil prices stay low, rising default rates are likely in the future. In fact, default rates in junk bonds have risen to their highest level in 6 years. This article will examine the current state of the junk bond market, the sustainability of current trends, and also recommend a way to play the rising yields and default risks using a credit default swap ETF. Current State of Bond Yields (click to enlarge) Since the European Debt Crisis, which peaked in 2012, junk bond yields had been steadily falling outside of a small blip in 2014. Starting around the end of 2014, however, the increase in yields began in earnest and is now accelerating to the quickest pace since 2011. Yields are spiking, and while this is still far from what is seen during a credit crisis, the warning signs are there. Junk bond yields are now more than 20% higher than they were just a year ago, and there is no sign of an impending correction. On the contrary, the fundamentals seem to be pointing toward a further rise in junk bond yields. Explaining Recent Price Action (click to enlarge) Much of the current trend in junk bond yields can be explained by referring back to oil prices. As oil prices started to fall in 2014, yields immediately began to rise in response. When the oil price bottomed at the start of 2015, yields steadied a bit, though the trend toward rising yields remained. There was hope that oil prices would continue to rebound in the second quarter of the year, but those hopes have been dashed as oil has stood its ground around $60 a barrel. At this point, yields have responded by rising even more and accelerating. While oil explains much of this phenomenon, the increase in yields cannot be blamed totally on the black liquid. (click to enlarge) Another major trend that came about starting in 2014 has been falling corporate profits. These numbers have been showing consistent deterioration since then, and while the Q1 2015 numbers give a sign of possible hope, the historical record does not look good. The last time that corporate profits fell this much, bond yields soared in response after about a year and a half. If that sets any precedent, then bond yields are again about to soar either at the end of this quarter or in the next, especially if corporate profits are weak yet again. Given the past, now is absolutely the time to buy protection against rising yields and bond defaults. The ProShares CDS Short North American HY Credit ETF (BATS: WYDE ) may be the perfect way to play the current situation. As the ETF is short high yield credit, it profits when default rates rise, as the ETF owns a broad basket of high yield credit default swaps. While offering protection against default risk, WYDE has also shown itself to protect against time decay. Since its inception in August of 2014, WYDE has lost less than 5% of its value. CDS protection does have a cost over time, and given that it has lost so little over the time, WYDE is a safe way to play the high yield bond market with little time decay. Summary and Action to Take Junk bonds are a risky proposition right now. Oil prices look to have stalled and a quick recovery to previous levels looks a long way off. In addition, corporate profits have been weak and have been deteriorating at a pace not seen since the onset of the financial crisis. Now is the perfect time to buy protection against a spike in junk bond yields by buying credit default swaps. For the small retail investor, CDS exposure is difficult, and thus gaining exposure via the WYDE ETF may be the perfect way to do so. Disclosure: I am/we are long WYDE. (More…) I wrote this article myself, and it expresses my own opinions. I am not receiving compensation for it (other than from Seeking Alpha). I have no business relationship with any company whose stock is mentioned in this article.

Market Vectors Vietnam ETF: Look Elsewhere

Summary The Market Vectors Vietnam ETF has lost 10.59% in the past year, while the VN Index has gained 5.45%. Vietnam is most successfully navigated by actively managed funds, that invest in companies that are undervalued and have high dividend yields. Foreign Ownership Limitation in Vietnam is another factor that attributes to the poor performance of the Market Vectors Vietnam ETF. Investment has been shifting towards Vietnam, due to some of the following factors that make investment in this country attractive: GDP growth of 6.12% in the second quarter of 2015. Manufacturing shift to Vietnam, due to wages in Vietnam being 46% lower than China . High youth population that is highly ambitious, making it an attractive destination for investment. Publicly listed companies that are undervalued and pay higher dividends relative to other countries in Asia. Vietnam can be characterized as a country with acceptable risks and high returns. However, there is a large discrepancy between the performance of investment funds in Vietnam. Choosing to invest in the wrong investment fund can be the difference between high returns and negligent returns or losses. The Market Vectors Vietnam ETF (NYSEARCA: VNM ) has lost 10.59% in the past year, which is very strange considering that the VN Index has gained 5.45% in the past year. While exchange traded funds provide low management fees and convenient access to global equity, a fund that loses substantially in a market like Vietnam should be a red flag for investors. Those wishing to gain exposure to Vietnam should give serious consideration as to whether this fund is a true reflection of the opportunities in Vietnam. While I am personally bullish on Vietnam and invest directly in listed equity in Vietnam, I question the value of this fund. Top Holdings of Listed Equity in Vietnam Taking a closer look at the top holdings of the fund’s listed equity, we can see that the top holdings are not a true reflection of the growth potential of Vietnam. The average P/E ratio for these companies is 17.8, the average 2014 ROE was 12%, and the average 2014 ROA was 5.1%. Strategic Navigation The average valuation is not at all attractive, as the average P/E ratio in Vietnam is 12.5. Actively managed investment funds that invest in a diversified portfolio of securities, with a lower P/E ratio than average, have been extremely successful. Moreover, targeting the SME sector is another effective strategy, which has allowed some funds to have dividend yields of 10%/year . It is clear to see that Vietnam is most successfully navigated by actively managed funds, that invest with the criteria of low valuation and high dividend yields. Compared to the VN Index, and especially actively managed funds, the performance of the Market Vectors Vietnam ETF is inferior. These investment funds, which are not listed on US Exchanges, provide verification that there is extreme opportunity for profit in this region, which is not reflected in the performance of the Market Vectors Vietnam ETF. Foreign Ownership Limitation The foreign ownership limitation is another factor in Vietnam that impacts the performance of foreign investment funds. The foreign ownership limitation in Vietnam generally restricts foreign ownership of listed equity to 49%, although it is limited to 10% or 30% in other cases. The Market Vectors Vietnam ETF does not currently invest in shares of companies that are fully held by foreign investors. This restricts the fund from investing in highly valuable companies that foreign investors are actively seeking, even to the point of being willing to pay a premium of up to 20% . PXP Vietnam Asset Management is another extremely successful company in Vietnam, whose success is partially attributed to the fact that 52.5% of its portfolio NAV is comprised of companies that are fully held by foreign investors. ETF Skepticism Exchange Traded Funds can sometimes be desirable, as they are characterized by low management fees and can sometimes produce desirable returns for investors. However, the case with Vietnam seems to be very clear; the most profitable venture for investors is to invest in actively managed funds or invest directly on the stock exchange in Vietnam. The inability of this fund to invest in companies that are fully held by foreign investors and its failure to invest in companies with low valuation are both factors that attribute to the fund’s poor performance. Sure the ETF is near its 52-week low and maybe there is some chance of profit, but it is clearly not the best form of investment in Vietnam for those seeking to leverage off of the long-term opportunities that Vietnam presents. I personally trade directly on the stock exchange in Vietnam, would never invest in this ETF, and believe that Vietnam is best navigated by the previous investment funds that I mentioned in this article. Alternatives Listed on US Exchanges Finding worthwhile investments in Vietnam that are listed on US Exchanges is very challenging, since there are not any ADRs specifically for Vietnam. However, investors can consider the following as alternatives for the Market Vectors Vietnam ETF: Vietnam Holdings Ltd . ( OTC:VNMHF ): Vietnam Holdings Ltd. is a close ended investment company that invests in listed equity in Vietnam. The company currently has a P/E of 5.33 and is investing in two companies, which are fully held by foreign investors, including DHG Pharmaceutical JSC and Vietnam Dairy Products JSC. These two factors may make it a worthwhile pursuit for investors. Samsung Electronics Co. Ltd. ( OTC:SSNLF ): Investors can also gain exposure to Vietnam indirectly by investing in Samsung, which shifted its manufacturing from China to Vietnam because of lower wages. Some of the holdings of the Market Vectors Vietnam ETF are listed on US Exchanges. These include Emerson Radio Corporation (NYSEMKT: MSN ), Student Transportation Inc. (NASDAQ: STB ), and DCP Midstream Partners LP (NYSE: DPM ). Conclusion Investors wishing to gain exposure to Vietnam should avoid the Market Vectors Vietnam ETF. The most attractive investments include investment funds not listed on US Exchanges, and directly investing in listed equity in Vietnam. However, the above alternatives that are listed on US Exchanges can be examined as potential alternatives. Disclosure: I/we have no positions in any stocks mentioned, and no plans to initiate any positions within the next 72 hours. (More…) I wrote this article myself, and it expresses my own opinions. I am not receiving compensation for it (other than from Seeking Alpha). I have no business relationship with any company whose stock is mentioned in this article.

The Factor-Based Story Behind Successful Growth Funds

Summary Most large cap stock active fund managers underperformed their benchmarks in the 15 years to December 2014. Active large growth funds performed much better than large value funds vis-à-vis benchmarks. Virtually all of actively managed growth funds’ outperformance can be explained by quantitative multi-factor analysis. Americans have invested trillions of dollars in actively managed mutual funds in the hope of beating an index such as the S&P 500 or the Russell 1000 Growth. At Gerstein Fisher, we believe that markets tend to do a pretty good job of pricing risk and that most investors are better off “buying the market” (via an index fund) than trying to beat it. But we also think that there’s a better way to invest in equities than through either purely passive indexing or traditional active management. I’ll get to that method shortly after sharing summary results of a multi-step fund performance study that we recently conducted. Active Funds and Benchmarks We analyzed two Morningstar categories of funds, large cap growth and large cap value, from January 1, 1990 to December 31, 2014. During this 15-year period, 37% of the growth funds and 42% of the value funds disappeared-liquidated, merged, etc. We studied this aspect to eliminate survivorship bias in the study; obviously, funds that are shuttered by managers tend to be the poor performers. In the next step, we measured how many of the surviving funds outperformed their benchmarks during the 15-year time frame. Of the large cap growth survivors, 67.5% beat their benchmark (Russell 1000 Growth), while just 49% of the living value funds beat their bogey (Russell 1000 Value). All told, 42% of the large cap growth funds that existed in January 1990 beat their benchmark, compared to only 28% of large cap value funds. Moreover, the average outperformance for active growth was 2.14 percentage points per year vs. just 1.17 points for the active value funds. Two conclusions we can draw from this research are that 1) It is very difficult for professional portfolio managers to outperform an index, and 2) Growth appears to be the investing style that quite consistently performs best among actively managed funds. In fact, neither of these conclusions is either particularly new or surprising, as past research by Gerstein Fisher and others has amply demonstrated. See, for example, ” In Mutual Funds, is Active vs. Passive the Right Question? ” Explaining Outperformance But here is where the research gets really interesting. We conducted an extensive statistical analysis of the large cap growth funds that outperformed. We drilled down and studied whether quantifiable company characteristics, or “factors”, could be used to explain the outperformance. We honed in on just four factors– size, value, momentum and profitability-to measure the extent to which excess exposure (relative to the Russell 1000 Growth Index) to these factors could explain outperformance. I’ll digress very briefly to explain the theory and evolution of multi-factor investing. In 1976, Steve Ross published a landmark paper on Arbitrage Pricing Theory, which explained that security returns are best explained by more than one factor.* Since then, academics have identified dozens of quantifiable variables, such as momentum, that impact stock returns. In effect, even stocks from different industries that share similar such characteristics should generate similar returns. The Exhibit below illustrates the premiums over a 40-year period for the four factors we used to analyze the active growth funds. Note, for instance, that investors were historically rewarded with a 3-point premium (per year) for investing in more profitable companies and 3.5 points for being in smaller companies. (click to enlarge) Now back to our study. When we accounted for the momentum, size, value and profitability factors, we found that only 1.6% of the managers actually outperformed the benchmark (after adjusting for positive tilts to these four factors), or generated positive alpha (i.e., excess return of a fund relative to its benchmark). Another way of stating this is that 98.4% of the outperformers had higher factor exposure than the benchmark. For example, 95% of these winners had a positive tilt to value (relative to the Russell 1000 Growth Index) and 64% had higher-than-index exposure to smaller companies. Given this evidence that outperformance of active growth managers is almost entirely explained through their (witting or unwitting) excess exposure to certain factors, the next question is whether there is a rigorous, methodical, quantitative way to target certain factor exposures in order to outperform the index over extended time periods. We believe that there is-the Multi-Factor® quantitative investing style that underpins our three equity mutual funds. In the coming weeks, I plan to write a series of articles to elaborate on the principles and applications of multi-factor investing. In advance of that, I invite you to read a short piece we recently published on this investment strategy: ” What is a Multi-Factor Investment Approach? ” Conclusion Active fund managers have great difficulty beating passive indexes over long time periods. Actively managed growth funds perform well relative to benchmarks compared to value funds, but nearly all of the growth funds’ outperformance can be explained quantitatively by multi-factor analysis. *Finance students will recognize the factor-premium formula for portfolio return–+β11 +β22 +… … + β n n + –where portfolio return is described as the sum of the risk-free rate, factor exposures, and alpha. Disclosure: I/we have no positions in any stocks mentioned, and no plans to initiate any positions within the next 72 hours. (More…) I wrote this article myself, and it expresses my own opinions. I am not receiving compensation for it. I have no business relationship with any company whose stock is mentioned in this article.