Tag Archives: seeking-alpha

Comparing 4 International Real Estate ETFs

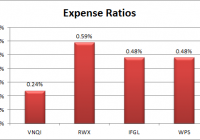
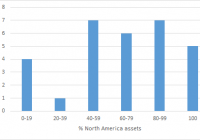
Summary I’m comparing VNQI, RWX, IFGL and WPS to find the best international real estate ETF. The results are split as no ETF won on all 3 metrics. Out of the 4, my favorite is VNQI, but I am concerned about the exposure to the Chinese market. The Vanguard Global ex-U.S. Real Estate Index Fund ETF (NASDAQ: VNQI ) is one of the best investments in international REITs. Unfortunately, it is also one of the only ones. This is an area of the market where the volume of competition is not particularly high and lower levels of competition can lead to lower levels of returns as companies are not battling to attract the consumer with the best value. I thought it would be worthwhile to compare VNQI with a few of the other options that are available to investors. For instance, investors may also be considering the SPDR® Dow Jones International Real Estate ETF (NYSEARCA: RWX ), the iShares International Developed Real Estate ETF (NASDAQ: IFGL ), or the iShares International Developed Property ETF (NYSEARCA: WPS ). Expense Ratios Due to a lack of competition, expense ratios in this space may be higher than in other areas. That’s unfortunate for investors and may give some investors good reason to look for other types of international exposure that have lower expense ratios. For instance, buying into ETFs that are investing in international companies rather than focused on REITs will result in reaching a market with more competition and lower expense ratios. I charted the expense ratios for the four ETFs below. The expense ratio drains money away from the investor each year and results in a lower CAGR (compound annual growth rate). Therefore, I see lower expense ratios as very favorable. I would prefer to see an expense ratio below .24%, but there are not many options to choose from. Bid-Ask Spreads Liquidity is a very real cost. When investors are going to buy an ETF, they will face the challenge of covering the bid-ask spread. It is true that they may use a limit order to avoid the bid-ask spread, but then the investor still faces execution uncertainty as their order might not trigger. If the order doesn’t trigger and the investor missed the opportunity to buy, they have missed out on the opportunity. When the bid-ask spread is smaller and liquidity is higher, it is more likely that the order will trigger (assuming it is set near the normal spread) and the investor will have a completed transaction. Therefore, I see a smaller spread as being advantageous. All else equal, I would be more inclined to buy into an ETF where the spread was smaller. While researching for this article I checked the spreads on each security. Keep in mind these are spreads at one point in time so they may fluctuate meaningfully from their average level. To make the spreads more indicative of the value lost due to a wider spread, I’m using spreads as a percentage of the share price rather than using the amount of cents in the spread. If an investor buys and sells frequently, a larger spread becomes more important than a larger expense ratio on the ETF. Holdings in China I’m bearish on the Chinese market because I believe the market has become too frothy as investors are able to access margins and bid up prices with money they don’t have. If the losses start and the domestic investors lose money, they may lose the purchasing power necessary to support the domestic companies. As a result, I would prefer international ETFs with a smaller allocation to China. I’m treating investments in Hong Kong as being separate, though I wouldn’t be surprised to see a strong correlation between the two and I would be happy to see lower levels of investment in Hong Kong. While the Vanguard Global ex-U.S. Real Estate ETF is offering investors the lowest expense ratios and best liquidity, it also offers the most exposure to China. Over 8% of the equity value is coming from China for VNQI, which is higher than any of the other ETFs. The other ETFs have all kept China out of their portfolio. In my opinion, the ideal investment in international REITs would more closely resemble VNQI on the first two metrics without having China as a meaningful weight in the portfolio. Since I’m concerned about a correlation between Hong Kong and the main Chinese market, I want to recognize the exposure to that market as well. VNQI performs the best on this metric with less than 11% in Hong Kong while RWX comes in right behind it with about 11.5%. For IFGL the exposure on Hong Kong is 17% and for WPS it is 15%. Conclusion I have to give the nod on portfolio holdings to RWX while crowning VNQI as the champ on the other metrics. IFGL and WPS both offer too much exposure to Hong Kong, too little liquidity, and too high of expense ratios. If an investor really wants to play with IFGL and WPS, it may be best to become very knowledgeable about them and use limit orders to prevent crossing the bid-ask spread. Disclosure: I am/we are long VNQI. (More…) I wrote this article myself, and it expresses my own opinions. I am not receiving compensation for it (other than from Seeking Alpha). I have no business relationship with any company whose stock is mentioned in this article. Additional disclosure: Information in this article represents the opinion of the analyst. All statements are represented as opinions, rather than facts, and should not be construed as advice to buy or sell a security. Ratings of “outperform” and “underperform” reflect the analyst’s estimation of a divergence between the market value for a security and the price that would be appropriate given the potential for risks and returns relative to other securities. The analyst does not know your particular objectives for returns or constraints upon investing. All investors are encouraged to do their own research before making any investment decision. Information is regularly obtained from Yahoo Finance, Google Finance, and SEC Database. If Yahoo, Google, or the SEC database contained faulty or old information it could be incorporated into my analysis.

X-Raying CEFL (Part 2): Geographical Distribution

Summary A previous article in this series investigated the leverage and expense ratio statistics of CEFL, a 2X leveraged CEF fund-of-funds. This article presents the geographical breakdown of CEFL. How much international exposure does CEFL contain? Introduction The ETRACS Monthly Pay 2xLeveraged Closed-End Fund ETN (NYSEARCA: CEFL ) is a 2x leveraged ETN offered by UBS. CEFL tracks twice the monthly return of the ISE High Income Index [YLDA], an index that is comprised of high-yielding close-ended funds [CEFs]. The methodology used to construct YLDA has been summarized here . The YieldShares High Income ETF (NYSEARCA: YYY ) tracks the same index as CEFL. While many investors are attracted solely by CEFL’s high yield (currently 20.39% ttm), I believe that it is also important to look “under the hood” of the fund and to understand its characteristics. In a previous article , we delved into the holdings of CEFL to derive relevant leverage and expense ratio statistics regarding this fund. From that analysis, we found that CEFL is approximately comprised of one-third equity and two-thirds debt, CEFL is effectively leveraged by 240%, and CEFL exhibits a total expense ratio of 4.92% per dollar invested in the fund (or 2.05% per dollar of assets controlled), after accounting for acquired fund expenses. This article seeks to present the geographical distribution of CEFL in terms of its overall holdings, or in terms of equity and debt components. Methodology The geographical distribution of the component funds was obtained from CEFConnect , Morningstar or the fund websites. As some CEFs only report their allocation by region rather than by country, it was decided to present the data in terms of region only. The five regions are North America (includes Canada), Europe (includes Russia), Asia Pacific (includes Japan and Australia), Latin American and Middle East/Africa (includes Turkey). There is also a sixth category of “other” due to the fact that some funds do not report beyond their top 10 country holdings. The funds The following table shows the fund name, ticker symbol, % assets, and % of assets in region. Fund Ticker Assets North America Europe Asia Pacific Latin America Middle East/Africa Other GAMCO GLBL GOLD NAT RES (NYSEMKT: GGN ) 4.52% 77.9 11.5 2.1 6.0 2.5 0.0 DOUBLELINE INCOME SOLUTIO (NYSE: DSL ) 4.38% 47.4 13.0 0.0 14.6 0.0 24.9 EATON VANCE TM GL DIV EQ (NYSE: EXG ) 4.28% 55.6 36.2 8.1 0.0 0.0 0.0 FIRST TRUST INTERMEDIATE (NYSE: FPF ) 4.28% 49.2 39.7 0.0 1.2 0.0 9.9 ALPINE TOTAL DYNAMIC DIVD (NYSE: AOD ) 4.27% 53.2 29.0 5.6 0.0 0.0 12.3 EATON VANCE LIMITED DURAT (NYSEMKT: EVV ) 4.26% 90.5 5.4 0.0 0.0 0.0 4.1 MFS CHARTER INCOME TRUST (NYSE: MCR ) 4.24% 67.6 11.8 2.3 0.0 0.0 18.3 CLOUGH GLBL OPPORTUNITIES (NYSEMKT: GLO ) 4.24% 88.9 3.6 12.3 0.0 0.0 -4.7 BLACKROCK CORPORATE HIGH (NYSE: HYT ) 4.20% 100.0 0.0 0.0 0.0 0.0 0.0 ALPINE GLOBAL PREMIER PRO (NYSE: AWP ) 4.19% 31.8 26.9 28.5 3.7 2.2 6.9 WESTERN ASSET EMG MKT DBT (NYSE: ESD ) 4.18% 0.0 25.4 4.5 57.3 0.0 12.8 VOYA GLBL EQTY DIVD FUND (NYSE: IGD ) 4.12% 45.8 39.3 8.7 0.0 0.0 6.2 PRUDENTIAL GL SH DUR HI Y (NYSE: GHY ) 4.11% 69.4 20.0 0.0 2.0 0.0 8.6 PIMCO DYNAMIC CREDIT INCO (NYSE: PCI ) 4.11% 76.1 6.5 12.0 5.5 0.0 0.0 BLACKROCK INTL GROWTH&INC (NYSE: BGY ) 3.91% 11.7 54.5 28.0 1.3 2.1 2.4 MORGAN STANLEY EMERGING M (NYSE: EDD ) 3.88% 0.0 33.3 23.3 43.2 26.6 0.0 EATON VANCE TAX-MGD DV EQ (NYSE: ETY ) 3.81% 92.9 6.6 0.0 0.0 0.5 0.0 ABERDEEN ASIA-PAC INCOME (NYSEMKT: FAX ) 3.43% 2.7 3.2 94.1 0.0 0.0 0.0 PRUDENTIAL SHORT DURATION (NYSE: ISD ) 3.15% 100.0 0.0 0.0 0.0 0.0 0.0 CALAMOS GLOBAL DYNAMIC IN (NASDAQ: CHW ) 3.11% 57.8 24.0 11.5 1.0 1.3 4.4 MFS MULTIMARKET INC TRUST (NYSE: MMT ) 2.84% 100.0 0.0 0.0 0.0 0.0 0.0 BLACKSTONE/GSO STRATEGIC (NYSE: BGB ) 2.65% 100.0 0.0 0.0 0.0 0.0 0.0 ALLIANZGI CONVERTIBLE & I (NYSE: NCV ) 2.42% 100.0 0.0 0.0 0.0 0.0 0.0 WESTERN ASSET HIGH INC FD (NYSE: HIX ) 2.19% 98.2 0.0 0.0 0.0 0.0 1.8 BLACKROCK MULTI-SECTR INC (NYSE: BIT ) 1.89% 84.7 12.6 1.2 0.0 0.0 1.6 WELLS FARGO ADV MULTISECT (NYSEMKT: ERC ) 1.56% 78.8 4.6 2.2 4.5 2.3 7.6 ALLIANZGI CONV & INCOME I (NYSE: NCZ ) 1.35% 84.2 15.8 0.0 0.0 0.0 0.0 WELLS FARGO ADVANTAGE INC (NYSEMKT: EAD ) 1.33% 94.9 4.4 0.1 0.0 0.0 0.6 NUVEEN PFD INC OPP FD (NYSE: JPC ) 1.12% 57.6 35.4 0.0 0.0 0.0 7.0 INVESCO DYNAMIC CREDIT OP (NYSE: VTA ) 0.96% 70.1 19.8 0.0 0.0 0.0 10.1( The following chart shows the frequency distribution of CEFs at different percentages of North American assets, the vast majority of which are U.S. assets. Geographical distribution The respective regions shown in the table above were, after accounting for the leverage of each fund, summed to determine the overall geographical distribution of CEFL. The results are presented in the graph below. We can see from the chart above that North America accounts for just over two-thirds (68.2%) of the assets of CEFL. The second-largest region is Europe, at 14.8%, followed by Asia Pacific, at 8.3%. Latin American and Middle East/Africa represent relatively minor regions at 3.9% and 0.4%, respectively. Finally, 4.4% of the assets were unaccounted for in this analysis. The next chart shows the geographical breakdown for the equity and debt components of CEFL. Recall that CEFL is comprised of approximately one-third equity and two-thirds debt. Note that for hybrid funds, I have made the assumption that the region distribution is the same for the equity and debt components of the fund. We can see from the chart above that the debt portion of CEFL contains more North American exposure (71.6%) compared to the equity portion (57.1%). On the other hand, the equity portion of CEFL contains more European exposure (25.9%) compared to the debt portion (11.4%). Discussion and conclusion This article sought to evaluate the geographical exposure of CEFL. The main conclusion from this analysis was that CEFL contained around two-thirds of North American (primarily U.S.) assets, meaning that the fund has around one-third of international exposure. What does this mean for investors? Obviously, investors who are uncomfortable with any level of international exposure should avoid CEFL, as around one-third of the fund is in foreign assets. However, other investors may be attracted to the diversification benefits offered by the international exposure of CEFL. For example, a portfolio of 70% U.S. stocks and 30% international stocks (close to the geographic allocation of CEFL) has returned 11.4% a year since 1950, which is about 2% more than S&P500, but with about 10% less risk. Additionally, I like that the North American component of CEFL contains a higher allocation to debt vs. equity than the European component of CEFL. European debt is currently low-yielding and hence expensive, with struggling countries like Spain (2.26%) and Italy (2.28%) having the same 10-year bond yields as the U.S. (2.26%), and even lower yields for Germany (0.75%) and France (1.16%). On the other hand, European stocks are a lot cheaper than U.S. stocks, with CAPE ratios of 8.6 and 16.5 for emerging and developed Europe, respectively, compared to 26.0 for the U.S. Therefore, value investors like myself would be especially pleased with CEFL’s higher allocation towards European equities compared to European debt. I hope this information will be useful for investors in or considering investing in the fund. Disclosure: I am/we are long CEFL. (More…) I wrote this article myself, and it expresses my own opinions. I am not receiving compensation for it (other than from Seeking Alpha). I have no business relationship with any company whose stock is mentioned in this article.

Will South Korean Equities Take Off After A Japanese Rally?

Summary Over the decades, the South Korean economy has become heavily dependent on exports. In recent years, strong won have not facilitated growth of South Korea’s GDP and the profitability of local companies. Korean equities trade at very low multiples that limit the downside risk. The introduction of any monetary stimuli could potentially kick off an equity rally. In that case, DBKO could be a winning security. Unlike Japanese stocks, the South Korean equity market has not performed well in recent years. While the most popular Japanese index, Nikkei 225, has appreciated more than 110% since the start of Abenomics in late 2012, South Korean KOSPI has gained almost nothing during the same period. Even though Japan and South Korea have much in common, they are very different in many aspects as well. For example, both countries are known for exporting high-tech products and high-quality vehicles. The South Korean economy is, however, much more reliant on exports, as demonstrated by the graph below. Data Source: The World Bank Strong won and stagnating profitability The reason behind the recent lackluster South Korean equity market returns lies in weak corporate profitability caused primarily by strengthening won. While earnings of companies listed on the First Section of the Tokyo Stock Exchange rose by 97.9% from 11/30/12 (the beginning of Abenomics) to 4/1/2015, earnings of companies included in the MSCI Korea decreased by 2.6% over the same period. It is not a big surprise that earnings of companies such as Samsung ( OTC:SSNLF ), LG Display (NYSE: LPL ), Hyundai ( OTC:HYMPY ) and Kia Motors ( OTC:KIMTF ) were significantly hindered by strong domestic currency as more than half of their revenue comes from outside of the country. Cheap valuation Based on PE multiples, South Korean equities remain incredibly cheap in global comparison. Over the above-stated period, PE of MSCI Korea has expanded from only 10.0x to 10.3x as price and earnings remained almost unchanged. To gain a better insight, PE of TOPIX has decreased from 15.0x to 14.9x thanks to strong corporate profitability due to weakening yen. Moreover, some sectors of Korea Exchange trade at extremely low multiples. This is specifically the case with autos, semiconductors, banks and IT, which last month traded with PE of 6.13x, 8.84x, 8.16x and 10.54x respectively. Some sectors like autos and banks traded even below their book value, with PBV ratios of 0.90 and 0.56 respectively. Will BOK follow in BOJ’s footsteps and introduce monetary stimulus? Without a doubt, the relative strength of South Korean won has been distinctively magnified by foreign quantitative easing programs. South Korea has suffered a great loss of its product competitiveness on overseas markets in particular against Japan. Because both countries compete in very similar markets, the BOJ’s aggressive quantitative easing program has been fatal to South Korean exports. Despite the BOK cutting interest rates to record low levels, the question remains: What will the central bank do after it runs out of its conventional monetary policy measures? We can only speculate for now, but I don’t believe that South Korea would abandon the global currency war if it realizes how important exports are for its economy. President Park stated recently at the National Assembly: We are standing at a crossroads, facing our last golden opportunity; which road we take will determine whether our economy takes off or stagnates. Now is the time for the National Assembly, the Administration, businesses and the people to come together as one and make dedicated efforts to resuscitate the economy. Graph: JPY/KRW since the start of Abenomics (click to enlarge) Source: Yahoo Finance Conclusion The launch of any quantitative easing from the side of BOK would be a bold turning point not only for South Korean won, but also for profitability of South Korean companies as more than half of their revenue comes from abroad. Therefore, subscribing to commentaries of BOK’s board members and closely monitoring the JPY/KRW currency pair can become a potentially rewarding activity. The largest and most liquid South Korea ETF is the iShares MSCI South Korea Capped ETF (NYSEARCA: EWY ), which seeks to replicate the MSCI Korea index. However, this is not a FX-hedged fund and its capital returns in case of introduction of any monetary stimulus would be diminished by currency losses for investors denominated in U.S. Hence, I would consider buying the other two funds – the Deutsche X-trackers MSCI South Korea Hedged Equity ETF (NYSEARCA: DBKO ) and the WisdomTree Korea Hedged Equity ETF (NASDAQ: DXKW ). They both have the same expense ratio of 0.58% and around the same percentage share of assets within its top ten holdings. The key difference between these two funds is in their holdings. Whereas DXKW consists of shares of only 47 firms, DBKO is diversified across 107 companies with significant exposure to Samsung Electronics, which accounts for a fifth of the fund’s assets. Top 10 Equity Holdings as of 17-Jun-2015 Name & Ticker Weight (%) Samsung Electronics Co Ltd 20.77 Sk Hynix Inc ( OTC:HXSCF ) 4.13 Hyundai Motor Co 3.25 Naver Corp ( OTC:NHNCF ) 2.82 Shinhan Financial Group Ltd (NYSE: SHG ) 2.75 Posco (NYSE: PKX ) 2.33 KB Financial Group Inc (NYSE: KB ) 2.31 Hyundai Mobis Co Ltd 2.25 LG Chem Ltd ( OTC:LGCLF ) ( OTC:LGCEY ) 2.13 Amorepacific Corp ( OTC:AMPCF ) 2.10 Data Source: Deutsche Asset & Wealth Management I believe that significant exposure to Samsung Electronics may pay off, as it is one of the most valuable brands in the world with a proven track record of sales CAGR 20.8% from 1989 to 2013 as well as above average earnings growth potential, currently trading at 9.4x PE. Therefore, I believe that DBKO is the single best security to own for eventual South Korean economy revival. Disclosure: I/we have no positions in any stocks mentioned, but may initiate a long position in DBKO over the next 72 hours. (More…) I wrote this article myself, and it expresses my own opinions. I am not receiving compensation for it (other than from Seeking Alpha). I have no business relationship with any company whose stock is mentioned in this article.