Tag Archives: nysearcarwx

Ivy Portfolio August Update

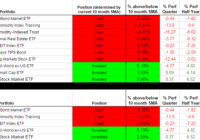
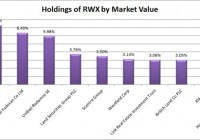
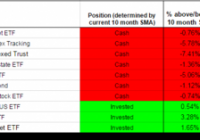
The Ivy Portfolio spreadsheet tracks the 10-month moving average signals for two portfolios listed in Mebane Faber’s book, The Ivy Portfolio: How to Invest Like the Top Endowments and Avoid Bear Markets . Faber discusses 5, 10, and 20 security portfolios that have trading signals based on long-term moving averages. The Ivy Portfolio spreadsheet tracks both the 5 and 10 ETF portfolios listed in Faber’s book. When a security is trading below its 10-month simple moving average, the position is listed as “Cash”. When the security is trading above its 10-month simple moving average, the positions is listed as “Invested”. The spreadsheet’s signals update once daily (typically in the late evening) using the dividend/split adjusted closing price from Yahoo Finance. The 10-month simple moving average is based on the most recent 10 months, including the current month’s most recent daily closing price. Even though the signals update daily, it is not an endorsement to check signals daily or trade based on daily updates. It simply gives the spreadsheet more versatility for users to check at his or her leisure. The page also displays the percentage each ETF within the Ivy 10 and Ivy 5 Portfolio is above or below the current 10-month simple moving average, using both adjusted and unadjusted data. If an ETF has paid a dividend or split within the past 10 months, then when comparing the adjusted/unadjusted data you will see differences in the percent an ETF is above/below the 10-month SMA. This could also potentially impact whether an ETF is above or below its 10-month SMA. Regardless of whether you prefer the adjusted or unadjusted data, it is important to remain consistent in your approach. My preference is to use adjusted data when evaluating signals. The current signals based on July 31st’s adjusted closing prices are below. This month the Vanguard Total Bond Market ETF (NYSEARCA: BND ), the SPDR Dow Jones International Real Estate ETF (NYSEARCA: RWX ), the Vanguard FTSE Emerging Markets ETF (NYSEARCA: VWO ), the PowerShares DB Commodity Index Tracking ETF (NYSEARCA: DBC ), the iShares S&P GSCI Commodity-Indexed Trust ETF (NYSEARCA: GSG ), the Vanguard REIT Index ETF (NYSEARCA: VNQ ) and the iShares TIPS Bond ETF (NYSEARCA: TIP ) are below their 10-month moving average. The spreadsheet also provides quarterly, half yearly, and yearly return data courtesy of Finviz. The return data is useful for those interested in overlaying a momentum strategy with the 10-month SMA strategy: (click to enlarge) I also provide a “Commission-Free” Ivy Portfolio spreadsheet as an added bonus. This document tracks the 10-month moving averages for four different portfolios designed for TD Ameritrade, Fidelity, Charles Schwab, and Vanguard commission-free ETF offers. Not all ETFs in each portfolio are commission free, as each broker limits the selection of commission-free ETFs and viable ETFs may not exist in each asset class. Other restrictions and limitations may apply depending on each broker. Below are the 10-month moving average signals (using adjusted price data) for the commission-free portfolios: (click to enlarge) (click to enlarge) Disclosure: None

RWX: Not My First Choice For International Real Estate

Summary RWX has too much volatility and correlation to the S&P 500. The dividend yields aren’t bad, but they aren’t great enough to justify the investment. The high expense ratio hammers home my view that this just is not an attractive way to do international investing. Investors should be seeking to improve their risk adjusted returns. I’m a big fan of using ETFs to achieve risk adjusted returns relative to the portfolios that normal investors can generate for themselves after trading costs. A substantial portion of my analysis will use modern portfolio theory, so my goal is to find ways to minimize costs while achieving diversification to reduce the total portfolio risk level. In this article, I’m reviewing the SPDR Dow Jones International Real Estate ETF (NYSEARCA: RWX ). What does RWX do? RWX attempts to track the investment results of the Dow Jones Global ex-U.S. Select Real Estate Securities Index. The ETF falls under the category of “Global Real Estate”. Does RWX provide diversification benefits to a portfolio? Each investor may hold a different portfolio, but I use the SPDR S&P 500 Trust ETF (NYSEARCA: SPY ) as the basis for my analysis. I believe SPY, or another large cap U.S. fund with similar properties, represents the reasonable first step for many investors designing an ETF portfolio. Therefore, I start my diversification analysis by seeing how it works with SPY. The correlation is about 84%, which is high enough that RWX does not offer the level of diversification benefits that I would like to see. Standard deviation of monthly returns (dividend adjusted, measured since January 2007) The standard deviation isn’t going to make a strong case for investing in RWX. For the period I’ve chosen, the standard deviation of monthly returns is 142% of the deviation for the S&P 500. Due to the combination of volatility and correlation, it is not viable to use RWX as a way to reduce the portfolio risk if the major holding in the portfolio is SPY or another major domestic equity ETF since most major domestic equity ETFs have extremely high correlations to SPY themselves. I don’t believe historical returns have predictive power for future returns, but I do believe historical values for standard deviation of returns relative to other ETFs have some predictive power on future risks and correlations. Yield The distribution yield is 3.03%. This may be one of the strongest areas for the ETF, but investors can find similar levels of yield on domestic equity REIT ETF investments with lower levels of risk. Expense Ratio The ETF is posting 0.59% for an expense ratio. Since I focus on buying ETFs with expense ratios below 0.10%, the costs on this investment are way above my comfortable threshold. However, the overall international REIT ETF sector has high expense ratios. Market to NAV The ETF is trading at a 0.21% premium to NAV currently. I think any ETF is significantly less attractive when it trades above NAV. The premium to NAV is a little surprising since the trading volume (over 600,000) should be enough to mitigate any meaningful deviation from NAV. On the other hand, when I look at the average monthly premium/discount to NAV, I see that over the last year the ETF has often bounced between trading at premiums and discounts to NAV. The most notable period was October of 2014 when the ETF averaged a premium of nearly 1.5% to book value. Largest Holdings The diversification within the ETF is pretty weak as demonstrated by my chart of the top holdings. (click to enlarge) Despite the large positions in a few of the holdings, doing individual due diligence on each investment would be fairly difficult. Investors buying into the international REIT ETF will need to rely on markets being at least somewhat efficient. Allocation by Country The following chart breaks down the holdings by country. (click to enlarge) When it comes to international diversification, I’m fairly happy with the way the portfolio is set up. For it being a real international fund, I would prefer some exposure to Africa and South America in the portfolio, but on the whole, diversification is fairly solid. It is a pet peeve for me when funds label themselves as international and then put 40% to 70% of the portfolio in a single foreign country. Conclusion In my opinion, it is difficult to make a solid argument for the use of the SPDR Dow Jones International Real Estate ETF under modern portfolio theory. The high level of volatility combined with the high correlation leaves investors requiring a higher expected level of return on the investment. I don’t see that as a likely result when the ETF is charging a high expense ratio. The holdings would have to significantly outperform the S&P 500 over the long term to provide enough returns to compensate investors for the additional risk. On top of the higher level of returns, the ETF also has to be able to cover the higher expense ratios. In short, I’m just not seeing a compelling long-term option for inclusion in my portfolio. Disclosure: I/we have no positions in any stocks mentioned, and no plans to initiate any positions within the next 72 hours. (More…) I wrote this article myself, and it expresses my own opinions. I am not receiving compensation for it (other than from Seeking Alpha). I have no business relationship with any company whose stock is mentioned in this article. Additional disclosure: Information in this article represents the opinion of the analyst. All statements are represented as opinions, rather than facts, and should not be construed as advice to buy or sell a security. Ratings of “outperform” and “underperform” reflect the analyst’s estimation of a divergence between the market value for a security and the price that would be appropriate given the potential for risks and returns relative to other securities. The analyst does not know your particular objectives for returns or constraints upon investing. All investors are encouraged to do their own research before making any investment decision. Information is regularly obtained from Yahoo Finance, Google Finance, and SEC Database. If Yahoo, Google, or the SEC database contained faulty or old information it could be incorporated into my analysis.

Ivy Portfolio July Update

The Ivy Portfolio spreadsheet track the 10 month moving average signals for two portfolios listed in Mebane Faber’s book The Ivy Portfolio: How to Invest Like the Top Endowments and Avoid Bear Markets . Faber discusses 5, 10, and 20 security portfolios that have trading signals based on long-term moving averages. The Ivy Portfolio spreadsheet tracks both the 5 and 10 ETF Portfolios listed in Faber’s book. When a security is trading below its 10 month simple moving average, the position is listed as “Cash”. When the security is trading above its 10 month simple moving average the positions is listed as “Invested”. The spreadsheet’s signals update once daily (typically in the late evening) using dividend/split adjusted closing price from Yahoo Finance. The 10 month simple moving average is based on the most recent 10 months including the current month’s most recent daily closing price. Even though the signals update daily, it is not an endorsement to check signals daily or trade based on daily updates. It simply gives the spreadsheet more versatility for users to check at his or her leisure. The page also displays the percentage each ETF within the Ivy 10 and Ivy 5 Portfolio is above or below the current 10 month simple moving average, using both adjusted and unadjusted data. If an ETF has paid a dividend or split within the past 10 months, then when comparing the adjusted/unadjusted data you will see differences in the percent an ETF is above/below the 10 month SMA. This could also potentially impact whether an ETF is above or below its 10 month SMA. Regardless of whether you prefer the adjusted or unadjusted data, it is important to remain consistent in your approach. My preference is to use adjusted data when evaluating signals. The current signals based on June 30th’s adjusted closing prices are below. As of the close May 29, the PowerShares DB Commodity Index Tracking ETF (NYSEARCA: DBC ) , the iShares S&P GSCI Commodity-Indexed Trust ETF (NYSEARCA: GSG ), the Vanguard REIT Index ETF (NYSEARCA: VNQ ) and the iShares TIPS Bond ETF (NYSEARCA: TIP ) were below their 10 month moving average. This month those 4 ETFs remain below their moving average. In addition, the Vanguard Total Bond Market ETF (NYSEARCA: BND ), the SPDR Dow Jones International Real Estate ETF (NYSEARCA: RWX ), TIP and the Vanguard FTSE Emerging Markets ETF (VWO ) are now also below their 10 month moving average. The spreadsheet also provides quarterly, half year, and yearly return data courtesy of Finviz . The return data is useful for those interested in overlaying a momentum strategy with the 10 month SMA strategy: (click to enlarge) (click to enlarge) I also provide a “Commission-Free” Ivy Portfolio spreadsheet as an added bonus. This document tracks the 10 month moving averages for four different portfolios designed for TD Ameritrade, Fidelity, Charles Schwab, and Vanguard commission-free ETF offers. Not all ETFs in each portfolio are commission free, as each broker limits the selection of commission-free ETFs and viable ETFs may not exist in each asset class. Other restrictions and limitations may apply depending on each broker. Below are the 10 month moving average signals (using adjusted price data) for the commission-free portfolios: (click to enlarge) (click to enlarge) Disclosures: None