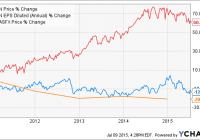
Summary Northwest Natural Gas offers a favorable dividend yield and very strong dividend increase record to yield-seeking investors. The company’s growth prospects are less attractive, however, due to its poor earnings history, high dividend payout ratio, and relatively low capex plans. The presence of warm weather conditions later in the year could make it difficult for the company to achieve management’s EPS guidance for FY 2015 and FY 2016. Its shares are overvalued and do not provide potential investors with a sufficient buffer to offset its poor prospects for earnings and dividend growth. Potential investors should look elsewhere. The share price of Oregon-based public natural gas utility Northwest Natural Gas (NYSE: NWN ) recently approached a 5-year low (see figure) as investors turned bearish on dividend stocks and the company reported disappointing results for Q4 2014 and Q1 2015. Its shares have vastly underperformed the gas utilities sector as its earnings have steadily fallen since FY 2011, excluding a modest increase in FY 2013. While management’s guidance is for its non-adjusted earnings to continue this downward trend, analysts are forecasting back-to-back increases on an adjusted basis for FY 2015 and FY 2016. This article evaluates Northwest Natural Gas as a potential long investment in light of the current operating environment and these forecasts. NWN data by YCharts Northwest Gas at a glance Headquartered in Portland, Oregon, Northwest Natural Gas provides natural gas and related services to more than 700,000 customers in the western half of that state and southwest Washington. It is Oregon’s largest natural gas utility with 14,000 miles of mains and service lines. While its regulated natural gas utility operations represent its primary business segment, the company also owns 31 Bcf of underground natural gas storage capacity and 2 Bcf of LNG storage capacity, the latter of which could be expanded by an additional 10 Bcf in coming years. Its natural gas operations provide the vast majority of its revenue and earnings, however, reaching 98% in recent quarters. The natural gas operations have also benefited from the presence of a moderately favorable regulatory scheme in Oregon that provides weather normalization and decoupling mechanisms to minimize the impact of extreme weather periods on earnings. Finally, the natural gas operations have also benefited from moderate customer growth, with the total number increasing by 4% over the last five years, due to natural gas having only a 60% market share of the heating market in the company’s service area. Northwest Gas has been a stalwart provider of dividends (see figure), with the company stating that its Q4 2014 dividend increase represented its 59th consecutive annual hike. The company’s forward yield of 4.22% is higher than the gas utility sector median , although this has come at the cost of a dividend payout ratio of 0.85 in the most recent fiscal year, well above the sector average. While many utilities are actively working to increase their payout ratios, the presence of such high ratios over a sustained period indicates that Northwest Natural Gas sees few opportunities for substantial future capex, rate base, and ultimately earnings growth. Further evidence of a lack of growth opportunities is provided by the fact that the company’s annual diluted EPS peaked in FY 2010 and has steadily declined in every subsequent year but one. Dividend growth has slowed to a crawl recently as well, with the most recent increase to $0.465 on a quarterly basis representing a mere 1.1% change over the previous quarter and 7% increase over the previous five years (by contrast, peer Southwest Gas (NYSE: SWX ) recently increased its dividend by 11% ). NWN Dividend (Annual) data by YCharts Q1 earnings report Northwest Natural Gas reported underwhelming results for Q1 in May due to a combination of an unfavorable regulatory decision and warm winter weather. Its revenue fell by 10.8% YoY from $293.4 million to $261.7 million, missing the analyst consensus by $42.2 million. The decline was primarily the result of a 19% YoY decline to the company’s natural gas sales and transportation volumes, which was in turn due to an average Q1 temperature that was 22% warmer than the previous year and 20% warmer than the long-term average. The consolidated revenue number was also negatively impacted by last year’s steep fall in the price of natural gas, which coincided with the expiration of the company’s storage segment’s long-term, high-priced storage contracts. These were ultimately replaced with short-term contracts containing lower prices, pushing the segment’s revenue down by $2.5 million YoY from $7.8 million. Northwest Natural Gas Financials (non-adjusted) Q1 2015 Q4 2014 Q3 2014 Q2 2014 Q1 2014 Revenue ($MM) 261.7 240.3 87.2 133.2 293.4 Gross income ($MM) 136.0 120.5 55.0 74.9 138.2 Net income ($MM) 28.5 28.5 (8.7) 1.1 37.9 Diluted EPS ($) 1.04 1.04 (0.32) 0.04 1.40 EBITDA ($MM) 73.1 79.7 14.9 33.0 94.6 Source: Morningstar (2015). Consolidated operating income fell from $75 million to $53 million YoY. While the impact of the fall in consolidated revenue on gross margin was mostly offset by a 1.3% increase to the number of customers over the trailing twelve month period, the fall in operating income was primarily due to an increase to O&M expenses of $18.7 million. This increase was the result of a regulatory decision to disallow the recovery of $15 million of environmental costs, resulting in a $9 million after-tax charge to the company. The operating income result was boosted to the tune of $21.8 million by the aforementioned weather normalization mechanism, however, offsetting much of the negative impact of the quarter’s warm weather. Net income came in at $28.5 million, down from $37.9 million the previous year. Adjusted for the regulatory disallowance, however, net income came in at $37.6 million. Non-adjusted diluted EPS fell to $1.04 from $1.40 the previous year, while adjusted diluted EPS was $1.37. While only a slight decline YoY, the adjusted result still missed the consensus estimate by $0.14. The natural gas utility segment’s EPS increased by $0.04 YoY while the storage segment’s EPS fell by $0.06 over the same period. Most disappointing to investors was the continued decline of the company’s ROE,which fell to 6.3% TTM. In addition to being well below its FY 2009 level of 9.1%, the trailing result is also substantially lower than the company’s allowed ROEs of 9.5% and 10.1% in Oregon and Washington, respectively. The company’s operating cash flow fell substantially in Q1 from $220.1 million in the previous year to $118.2 million. This was attributed to the receipt in Q1 2014 of a $91 million environmental insurance recovery payment, however. While the cash reserve fell to $5.2 million from $17.9 million YoY, management stated during the Q1 earnings call that the company ended Q1 with strong liquidity, as evidenced in part by the fact that it had only $621.7 million in long-term debt and a current ratio of 0.79, up slightly YoY. Outlook Management affirmed during the Q1 earnings call its FY 2015 EPS guidance range of $1.77-$1.97 on a non-adjusted basis and $2.10-$2.30 on an adjusted basis (the annual adjustment being the same as the Q1 adjustment resulting from the regulatory disallowance). This guidance range assumes that customer growth will maintain its recent pace and that weather conditions during the rest of the year will be the same as the long-term average. Investors should be aware of the sensitivity of both of these assumptions to conditions that are outside of the company’s control, however, given their importance to its earnings. Having recently completed comprehensive safety upgrades and with little in the way of short-term capacity expansion planned, Northwest Natural Gas expects to achieve total capex in FY 2015 of $145 million, down from FY 2012 and FY 2013. Investment in storage capacity and pipeline expansions to meet possible industrial demand growth for natural gas is, in addition to not being certain, still several years out. Earnings growth in the next two years will therefore depend on the service area’s weather and economic conditions. In terms of weather, the El Niño event has finally appeared after going missing last year and federal scientists now believe that it could be one of the strongest such events on record. Great news for drought-plagued California could be bad news for Northwest Natural Gas, as El Niño events are historically associated with warm winter weather in the Pacific Northwest as the polar jet stream is pushed north. An earlier NOAA analysis found that Q1 and Q4 temperatures in Oregon and Washington were much warmer than normal during past events, suggesting that higher temperatures will be present in the company’s service area during the coming winter. While Oregon’s weather-normalization mechanism will mitigate the negative impact of these temperatures on the company’s earnings in the event that they are present, they are unlikely to completely offset them. On the plus side, the economies of Oregon and Washington have greatly improved in recent years after lagging behind the U.S. average. The unemployment rate in both states was higher than the U.S. average from 2010 until 2015, at which point the rates in both states fell below the national average (see figure). Likewise, GDP growth in both states recently moved above the national average (see second figure). Both developments are positive for Northwest Natural Gas since households with steady incomes consume more natural gas and are less likely to miss payments. They also indicate that housing construction will increase, resulting in more potential natural gas customers. Oregon Unemployment Rate data by YCharts Oregon Change in GDP data by YCharts These economic advantages are supported by the presence of much lower natural gas prices in 2015 to date than in the same period of the previous year. Electricity for heat has a substantial presence in Oregon and Washington and part of Northwest’s customer growth strategy is to convince residential consumers to convert to natural gas heating. This process is made easier when natural gas is expensive compared to electricity, as has been the case over the last several months (see figure). Oregon citygate natural gas prices at the time of writing are down 47% from their level a year ago, whereas Oregon’s electric retail rate is 16% higher over the same period. Cheap natural gas hurts the earnings from the company’s storage operations, to be sure, but at least this impact is offset by favorable customer growth conditions. Oregon Electric Utility Retail Price data by YCharts Valuation The consensus analyst estimates for FY 2015 and FY 2016 diluted adjusted EPS have fallen over the last 90 days in response to a recent increase to Oregon’s unemployment rate. The FY 2015 estimate has decreased from $2.24 to $2.19, while the FY 2016 estimate has decreased from $2.31 to $2.26. Based on the company’s share price of $43.37 at the time of writing, its trailing P/E ratio on non-adjusted and adjusted bases is 24.1x and 20.4, respectively. Its forward ratios for FY 2015 and FY 2016 are 19.8x and 19.2x, respectively. All of these are high relative to both the sector trailing average of 17.3x as well as the company’s own historical ranges (see figure). In fact, the upward trend of the company’s P/E ratios is incongruous with its declining earnings over the same period; unlike most of its peers, which have seen their shares’ P/E ratios follow their prices higher, the increasing P/E trend of Northwest’s share has been the result of earnings shrinkage rather than a strong share price. NWN PE Ratio (NYSE: TTM ) data by YCharts Conclusion Natural gas utility and storage company Northwest Natural Gas has been moving in the wrong direction in recent years, reporting steadily lower earnings and achieving ROEs that are well below the results allowed by its regulators. Its main attraction as a potential long investment is its extremely impressive track record of (admittedly small in recent years) dividend growth and decent forward yield. Furthermore, both the company’s management and analysts expect it to break its declining earnings streak and report consecutive annual earnings increases on an adjusted basis for the first time in several years in FY 2015 and FY 2016. I am not convinced that these attributes result in a compelling long argument, however, for two reasons. The first is that the earnings growth estimates are predicated on continued customer growth and average temperatures over the next six quarters. While the former is possible, a recent increase in Oregon’s unemployment rate aside, all indications are that Q4 and Q1 in the company’s service area will be substantially warmer than normal, negatively impacting its earnings in those quarters. Furthermore, the company’s share valuations have been pushed to an overvalued level due to its falling earnings in recent years, preventing potential investors from acquiring a buffer against El Niño negative earnings impacts. Between minimal capex growth, unfavorable weather conditions, and overvalued shares, I do not consider Northwest Natural Gas to be an attractive long investment at this time. Yield-seekers may wish to consider it, but I recommend that they instead consider those utilities with superior growth prospects such as IDACORP (NYSE: IDA ), Alliant Energy (NYSE: LNT ), or DTE Energy (NYSE: DTE ).