Tag Archives: seeking-alpha

Feeling Sensitive? Interest Rate Hikes May Tickle These Sectors

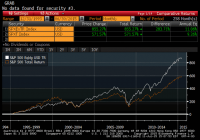
Greek uncertainty aside, the debate around a Federal Reserve interest rate hike is still a matter of when , not if . In this climate, which rate-sensitive stocks stand to benefit, and which could be stung by Fed moves? Indexes – Broadly Thinking Market interest rates – those set by the bond market – are already moving higher, reflecting trader belief that the Federal Reserve will crank up the interest rate dial at least once this year, possibly as soon as September. Ultra-low interest rate policy has goosed a bull market in the S&P 500 (NYSEARCA: SPY ) since March 2009. But now, economic prosperity will necessitate interest rate increases to keep growth from overheating and inflation from bubbling up. That means tighter interest rate policy is bullish for the broad market, even if it’s met by a collective grumble on Wall Street. That’s true at least for a time because it means the economy is on the right track. Watch for volatility, however, as traders speculate on how aggressive the Fed might be. Traders are mindful that the Fed could overshoot. Financials – In Their Best Interest Traditional banks and insurance companies can pull in more funds with higher interest rates, which means Fed hikes tend to be pro-financial stock. Banks that focus on traditional lower-risk community lending – more of a savings-and-loan model – will also potentially benefit from rising rates on the money they lend. Higher rates help insurance “float” portfolios earn more. Float is the gap between premium collection and claim payout. As that portfolio sits around, it needs to collect interest for the insurer. Conversely, the trading risk that can come with higher rates can reveal the risky underbelly of investment banks and their bond exposure. Consumer Spending – Who and What? Think luxury retailers, travel stocks, casinos, automakers – this type of spending tends to ramp up, not because of rate hikes, but because of the economic conditions triggering those rate hikes. It’s important to remember that consumer discretionary tends to do best in the early part of a rate-hike cycle, market history shows. That’s when the euphoria of the economic bounce is strongest and the bite of higher rates is less pronounced. Key for this pick is combing for attractive valuations and hidden gems in a category that could itself get pretty expensive. One might assume then – based on market history – that consumer staples don’t perform as well in a rising-rate environment. Investors might pick specific retailers or think about the growing e-commerce marts that offer all kinds of goods, both frivolous and fundamental. Technology – A Step Ahead Hey, if consumers are spend-happy in this environment, it’s likely that businesses are too. That means they’re retooling their technology needs. And as companies jockey to outrun any inflation risks, those most nimble with pricing power may come out on top. That’s because innovation (being early to market) can carry its own pricing power, which is potentially advantageous in this stage of an economic cycle. Utilities – Put in the Subs These typical dividend-payers are largely considered a bond alternative. During 2014, for example, when Treasury yields tumbled, the utilities sector more than doubled the 14% total return of the S&P 500 Index, according to Standard & Poor’s data. Because newly issued bonds will presumably pay higher issues in line with other rising interest rates, they tend to make the utilities alternatives less attractive. But utilities are a good example that more goes into stock-picking than just interest rate considerations. Utilities, for instance, win favor from some diversification-seeking investors because utilities are one way to limit exposure to U.S.-only consumer markets. That might sound good to investors who are casting a nervous eye toward Europe about now. Drilling Down – Think Companies, Not Sectors As for company-by-company selection, stock-picking criteria might focus on balance sheet health. Companies that need to borrow extensively to operate or innovate may struggle when money becomes more expensive. Investors should feel empowered to think of a Federal Reserve tightening period creatively. For instance, investors might consider a direct play on the improving job market with a look at job search companies; they stand to draw higher traffic as confident workers go for better pay and benefits. Robust payroll counts could also raise demand for payment processing companies or firms that run employee security checks. Bottom line: A big difference for this rate-hike campaign compared to others is the pace at which the Fed is expected to move. The economic recovery, and global turbulence, is still spotty, which could constrain the central bank to gradual hikes – hopefully providing enough time for stock investors to adjust accordingly. Inclusion of specific security names in this commentary does not constitute a recommendation from TD Ameritrade to buy, sell, or hold. Market volatility, volume, and system availability may delay account access and trade executions. Past performance of a security or strategy does not guarantee future results or success. Options are not suitable for all investors as the special risks inherent to options trading may expose investors to potentially rapid and substantial losses. Options trading subject to TD Ameritrade review and approval. Please read Characteristics and Risks of Standardized Options before investing in options. Supporting documentation for any claims, comparisons, statistics, or other technical data will be supplied upon request. The information is not intended to be investment advice or construed as a recommendation or endorsement of any particular investment or investment strategy, and is for illustrative purposes only. Be sure to understand all risks involved with each strategy, including commission costs, before attempting to place any trade. Clients must consider all relevant risk factors, including their own personal financial situations, before trading. TD Ameritrade, Inc., member FINRA / SIPC . TD Ameritrade is a trademark jointly owned by TD Ameritrade IP Company, Inc. and The Toronto-Dominion Bank. © 2015 TD Ameritrade IP Company, Inc. All rights reserved. Used with permission.

5 Ways To Beat The Market: Part 5 Revisited

Summary •In a series of articles in December 2014, I highlighted five buy-and-hold strategies that have historically outperformed the S&P 500 (SPY). •Stock ownership by U.S. households is low and falling even as the barriers to entering the market have been greatly reduced. •Investors should understand simple and easy to implement strategies that have been shown to outperform the market over long time intervals. •The final of five strategies I will revisit in this series of articles is equal weighing, a contrarian “buy low, sell high” approach to index rebalancing. In a series of articles in December 2014, I demonstrated five buy-and-hold strategies – size, value, low volatility, dividend growth, and equal weighting, that have historically outperformed the S&P 500 (NYSEARCA: SPY ). I covered an update to the size factor published on Wednesday, posted an update to the value factor on Thursday, covered the Low Volatility Anomaly on Friday, and tackled the Dividend Aristocrats yesterday . In that series, I demonstrated that while technological barriers and costs to market access have been falling, the number of households that own stocks in non-retirement accounts has been falling as well. Less that 14% of U.S. households directly own stocks, which is less than half of the amount of households that own dogs or cats , and less than half of the proportion of households that own guns . The percentage of households that directly own stocks is even less than the percentage of households that have Netflix or Hulu . The strategies I discussed in this series are low cost ways of getting broadly diversified domestic equity exposure with factor tilts that have generated long-run structural alpha. I want to keep these investor topics in front of the Seeking Alpha readership, so I will re-visit these principles with a discussion of the first half returns of these strategies in a series of five articles over the next five days. Reprisals of these articles will allow me to continually update the long-run returns of these strategies for the readership. Equal Weighting The S&P 500 Equal Weight Index is a version of the S&P 500 where the constituents are equal weighted as opposed to the traditional market capitalization weighting of the benchmark gauge. Guggenheim S&P 500 Equal Weight ETF (NYSEARCA: RSP ) replicates this alternative weight index. When the equal-weighted version of the index is rebalanced quarterly to return to equal weights, constituents which have underperformed are purchased and constituents which have outperformed are reduced, a contrarian strategy that has produced excess returns relative to the capitalization-weighted S&P 500 index over long-time intervals. Equal-weighting also gives an investor a greater average exposure to smaller capitalization stocks, a risk factor, detailed in the first article in this series , for which investors have historically been compensated with higher average returns. The composition of the equal-weighted index is more consistent with mid-cap stocks, which have historically outperformed large caps. The graph below shows the cumulative return of the S&P 500 Equal Weight Index relative to the cumulative return of the capitalization-weighted S&P 500 Index. (click to enlarge) Research by Plyakha, Uppal, and Vilkov (2012) puts some data behind my narrative that the size factor and contrarian rebalancing drive alpha in equal weighting strategies. Their analysis found that the higher systematic return of equal weighting relative to capitalization-weighted portfolios arose from relatively higher exposure to the size and value factors described in the first two articles in this series. The higher alpha of the equal-weighted strategy was determined to arise from periodic rebalancing, a contrarian strategy that exploits time-series properties of stock returns. The S&P 500 currently has a 17.1% weighting towards its ten largest constituents. Over one-sixth of the value of the broad market gauge is attributable to one-fiftieth of its components. To demonstrate the value of the size factor to equal-weighting, we should see the S&P 500 outperform the S&P 100 over the same twenty-year time interval. The S&P 100 Index, the hundred largest constituents of the S&P 500, trailing the S&P 500 by 11bps per year. If the contrarian rebalancing in equal-weighting also creates alpha, we should see an equal-weighted S&P 100 outperform a capitalization-weighted S&P 100. While I do not have data on the total return of an equal-weighted S&P 100 Index for 20 years, I do have fourteen years of data that show that an equal weighted index would have outperformed the capitalization-weighted index by 1.77% per year since the beginning of 2001. When I have previously discussed equal-weighting the S&P 500, some readers have commented that this is simply a mid-cap strategy, owing all of its outperformance to the size factor, but I hope this data shows that the contrarian re-balancing is also an important piece of the structural alpha gleaned through equal-weighting. Some of the most powerful ideas in finance are the easiest and simplest to implement. At its core, equal weighting overcomes the bias inherent in the capitalization-weighted benchmark index that forces investors to hold larger proportions of stocks that have risen in value. Periodic rebalancing allows the strategy to “buy low and sell high”, still the most tried and true way of making money in financial markets. Each of the five strategies I have outlined in this series share this notion that sometimes the best ideas are the simplest. I hope long-term buy-and-hold investors consider the size, value, low volatility, consistent dividend growth, and equal weighting approaches that have been demonstrated to outperform the market. Each of these factor tilts gleans their outperformance from slightly different risk factors, which should generate risk-adjusted outperformance over multiple business cycles. Low Volatility will have better performance in the down-turn, the size and value factors should generate outperformance in the recovery. I conclude this series of articles with a combined twenty plus year history of their total returns. The mix columns is an equal-weighting of the five different strategies. (You now also know that periodic rebalancing of these different strategies could enhance the alpha generated.) Over twenty-years, these strategies each produced higher absolute returns than the S&P 500 and higher average returns per unit of risk. Combining these strategies would have generated a 2.1% annualized outperformance with less than 90% of the variability of returns. A 2.1% annualized outperformance over this long time frame would have meant that investors who employed these strategies for twenty years would have had nearly a 50% higher nest egg today. (click to enlarge) With the return series side-by-side, readers should notice that Low Volatility stocks and the Dividend Aristocrats outperformed in weak equity years (2000-2002, 2008). Value stocks and small cap stocks have outperformed in the early stages of economic recoveries (2003, 2009). Understanding how these five strategies perform in different parts of the business cycle is a key towards value-accretive asset allocation. Thanks to all of my readers who contributed thoughtful comments on this series. Long-time readers may be surprised that momentum, a topic I have covered in many past articles, did not make it into my five strategies. The paired switching strategies in my momentum articles have also “beat the market”, but did so with a different source of alpha than the “buy and hold” approaches that I wished to spotlight in this series. Future work will follow-up on reader questions emanating from theses articles. Additional articles will also focus on combinations of these strategies that could well serve long-term investors. Disclaimer: My articles may contain statements and projections that are forward-looking in nature, and therefore inherently subject to numerous risks, uncertainties and assumptions. While my articles focus on generating long-term risk-adjusted returns, investment decisions necessarily involve the risk of loss of principal. Individual investor circumstances vary significantly, and information gleaned from my articles should be applied to your own unique investment situation, objectives, risk tolerance, and investment horizon. Disclosure: I am/we are long RSP, SPY. (More…) I wrote this article myself, and it expresses my own opinions. I am not receiving compensation for it (other than from Seeking Alpha). I have no business relationship with any company whose stock is mentioned in this article.

Global Equities Bounce; Still Oversold

At last Wednesday’s close, global markets had pretty much all reached extreme oversold territory. Below is a snapshot of where things stand after the rally we’ve seen over the last three trading days. The screen below shows the 30 largest country ETFs traded on US exchanges. The dot represents where the ETF is currently trading within its range, while the tail end represents where it was trading one week ago. The black vertical “N” line represents each ETF’s 50-day moving average, and moves into the red or green zones are considered overbought or oversold. We’ve also included both the 3-day change and year-to-date change for each ETF. Even after the huge bounce we’ve seen, nearly half of the countries shown remain slightly oversold, and none of the countries that have bounced have moved back above their 50-day moving averages. The 50-DMA is the next resistance level for most of these ETFs to clear, so we’ll be watching closely this week to see if the resistance can be broken. Share this article with a colleague