Tag Archives: seeking-alpha

Attractive Valuations And Potential To Outperform Peers Are Highlights Of American Electric Power

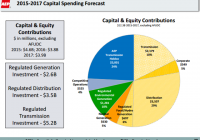
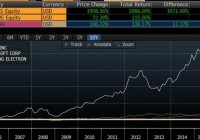
Summary Stock should trade at a 5%-10% premium to its peers’ average forward P/E. Company’s business fundamentals remain strong and efforts to strengthen regulated operations will bode well for stock price. As AEP increases regulated operations, its cash flows will become more certain, which will support dividend growth. American Electric Power (NYSE: AEP ) has strong business fundamentals and its future financial performance is expected to be solid. The stock stays an attractive investment prospect for income-seeking investors, as it offers a solid yield of 3.9% . Moreover, the company’s future growth is expected to stay strong, which will be mainly driven by its capital spending, directed at strengthening and expanding its regulated business operations. The company’s focus on regulated business operations is gaining significant traction, and it expects to achieve long-term growth of 4%-6%. Moreover, an important decision American Electric has to make in the next 3-6 months is regarding the faith of its merchant assets; either the company will sell the assets or continue to operate them. Furthermore, the stock’s current valuations are attractive. Strong Performance and Growth Catalysts American Electric has been delivering a strong financial performance, which is expected to continue in future, mainly driven by its increased focus on regulated operations. The company reported EPS of $0.88 for 2Q2015, beating consensus of $0.81. Also, rate increases and cost control initiatives positively affected American Electric’s performance for the quarter. In 2Q2015, the company secured a $123.5 million annual revenue increase and ROE of 9.75% in West Virginia, along with a $45.4 million annual revenue increase and ROE of 10.25% in Kentucky. Given the strong performance in the first half of 2015, the company increased its mid-point of 2015 EPS guidance by 2%; increased 2015 EPS guidance from $3.4-$3.6 to $3.5-$3.65 . In recent times, the company increased its focus on regulated operations, as the performance of unregulated/merchant operations has stayed weak and volatile because of low forward power prices. The company has a robust capital spending outlook, which will fuel its revenues and earnings growth in future years; American Electric plans to incur capital spending of $12.3 billion from 2015-2017. As the company has increased its focus on strengthening its regulated operations, 96% of the planned capital spending will be allocated to regulated business. Also, the company increased its 2015 capital spending guidance from $4.4 billion to $4.6 billion ; as the company continues to make progress with its cost control measures under its continuous improvement program, it freed up an additional $200 million for capital investment for 2015. The following chart shows the breakdown of the company’s planned capital spending. (click to enlarge) Source: Investors Presentation As forward power prices remain weak and volatile, utility companies in the U.S. are taking initiatives to reduce their merchant power operations. American Electric is also considering different strategic options for its 7,900MW of competitive fleet. I think that in the next 3-6 months, the company will make a decision regarding the future of its merchant assets, as currently it waits for the PJM auction results and for the pending Ohio PPA proposal. I think the best option for the company is to sell its merchant assets, as it will allow it to completely focus on regulated operations, which will improve its revenues and cash flow stability, and will augur well for the stock valuation. Moreover, I believe the company’s merchant assets sale value could range from $2 billion to $3.2 billion, depending on the outcome of the PJM auction prices, which are expected to settle by mid-August. Also, if the company chose to sell its merchant assets, it can direct the sale proceeds to increase its planned capital spending for future years, which will have a positive impact on the stock price. Other than the robust capital spending profile, the company has been making consistent efforts to improve its credit outlook. The company has successfully managed to reduce its total debt to total capitalization ratio from 57% in 2010 to 54.3% in 2Q2015. Also, the company’s qualified pension funding stands at 101% in 2Q2015, up from 96% in 1Q2015 and 97% in 2014, as displayed below in the figures. (click to enlarge) Source: Investors Presentation Valuation and Summation The stock’s current valuation stays attractive, as it is trading at a forward P/E of 15.08x , in contrast to its peers’ average forward P/E of 15.5x. Given, the company’s solid financial performance and robust capital spending profile, which will fuel its future growth, I think the stock should trade at a 5%-10% premium to its peers’ average forward P/E. Also, the company’s business fundamentals remain strong and the company’s efforts to strengthen its regulated operation will bode well for the stock price. And if the company chose to sell its merchant assets, its business risk profile will improve, as revenues and earnings will become more stable. Moreover, as the company is increasing its regulated operations, its cash flows will become more certain, which will support its dividend growth. Disclosure: I/we have no positions in any stocks mentioned, and no plans to initiate any positions within the next 72 hours. (More…) I wrote this article myself, and it expresses my own opinions. I am not receiving compensation for it (other than from Seeking Alpha). I have no business relationship with any company whose stock is mentioned in this article.

Let Them Eat Spreadsheets

Summary Numbers by themselves don’t tell us very much. Put another way, a text without a context can become a pretext. Because we don’t let sports teams make up their own rules as they play, we have certain standards that companies are supposed to go by when they report their earnings. Accounting isn’t “Calvinball.” By looking carefully at supporting ratios, and how they change over time, a careful analyst can sometimes sniff out whether a company’s earnings are real, or whether they’ve been enhanced by questionable accounting practices. Because financials are like a bathing suit: what they reveal is interesting, but what they conceal may be even more interesting. What good are financial statements? Most of us have a vague idea that Apple (NASDAQ: AAPL ) makes iPhones, that Panera (NASDAQ: PNRA ) runs restaurants, and that Wal-Mart (NYSE: WMT ) sells stuff. But how well do they do these things? Reports that Amazon (NASDAQ: AMZN ) earned 19 cents last quarter or that IBM (NYSE: IBM ) had sales of $20.8 billion leave us cold. Numbers by themselves don’t tell us very much. Put another way, a text without a context can become a pretext. Financial statements are intended to tell us what a company has (the balance sheet) and what the firm did with what it has (the income statement). They also disclose what management has done with its cash (the statement of cash flows). We need to know these things because ultimately any investment’s value is determined by how much cash it can generate for its investors, and how predictable (or unpredictable) this cash stream is. Because we don’t let sports teams make up their own rules as they play, we have certain standards that companies are supposed to go by when they report their earnings. Accounting isn’t ” Calvinball .” But electric utilities are different than banks, which differ from defense contractors. So management is allowed a little leeway as they apply the rules. Those choices, however, have to be reflected in the footnotes – usually “Footnote 1.” In order to make sense of the raw numbers, equity analysts use ratios to compare companies with each other. It’s notable that Apple had a 40% profit margin the last year, but that’s even more remarkable when you see that Microsoft’s (NASDAQ: MSFT ) margin was only 23%, and that Samsung’s ( OTC:SSNLF ) was just 10%. That may be one reason why Apple seems to be taking over the world. Source: Bloomberg Every year public companies have to hire outside accountants to examine their financial statements and verify that they’ve been playing by the rules. Although the financial news tends to report just one or two numbers each quarter – earnings per share and sales – there are lots and lots (and lots) of supporting statements that go into those. Businesses can be complicated, and disclosing their activities properly takes a lot of time and effort. Last year, GE’s (NYSE: GE ) annual financial statement was 247 pages long! By looking carefully at these supporting ratios, and how they change over time, a careful analyst can sometimes sniff out whether a company’s earnings are real, or whether they’ve been enhanced by questionable accounting practices. Because financials are like a bathing suit: what they reveal is interesting, but what they conceal may be even more interesting. Editor’s Note: This article discusses one or more securities that do not trade on a major U.S. exchange. Please be aware of the risks associated with these stocks. Share this article with a colleague

3 Unique ETFs Beating The Market

With the domestic economy recovering slowly but steadily and interest rates expected to remain low in near future, the overall backdrop for U.S. stocks remains positive. But as the bull market approaches its seven year anniversary, the easy money in stocks has already been made. Global growth worries, lackluster earnings, valuation concerns, China stock market turmoil and uncertainty relating to the Fed will also continue to weigh on the market. It is thus no surprise that the broad market continues to trade sideways with lackluster returns year-to-date. But some stocks have delivered outsized returns this year. Similarly some innovative ETFs following specialized strategies or tracking high growth areas have been rewarding their investors with stellar returns in 2015. Considering their outperformance potential, these could be held as satellite holdings in the portfolio, in order to spice up overall returns. A Shining Biotech Star: The ALPS Medical Breakthroughs ETF (NYSEARCA: SBIO ) Biotechs have been leading the bull market for the last 6-7 years. After this massive surge, valuations look lofty now by many measures, but there are still many reasons to be positive on the sector. Surging M&A activity, positive drug trial results and steady growth in the number of drugs being approved by the FDA have further boosted investor optimism and will continue to support these stocks. This fund tracks the Poliwogg Medical Breakthroughs Index. It invests mainly in mid and small cap stocks with market cap between $200 million and $5 billion. The index screens the U.S. listed biotech and pharma companies with one or more drugs in Phase II or Phase III FDA clinical trials. The index also screens for liquidity (average daily trading volume more than $1 million) and sustainability (cash for at least 2 years at their normal burn rate). Per ALPS, due to “patent cliff”, many blockbuster drugs from the 1990s and 2000s have been losing patent protection and large drug companies are struggling to replenish their pipelines. Further, due to time-consuming procedure and an alarming rate of failure for drug development, the bigger firms usually rely on new therapies processed by smaller firms that spend a lot more on R&D compared to their larger peers. This fund holds 75 stocks with Anacor Pharma (NASDAQ: ANAC ), Receptions and Horizon Pharma being the top 3 holdings. The product charges 50 bps in fees. Company specific risk is limited due to modified market cap weighting with maximum 4.5% of assets. The product launched in December last year and has gathered about $200 million in assets so far. SBIO has soared almost 52% this year. Foil Hackers with the PureFunds ISE Cyber Security ETF (NYSEARCA: HACK ) Our world is becoming increasingly digital-bringing us many exciting opportunities and possibilities–but also creating enormous challenges. Abundance of digital information and sophisticated tools available to process and share this information make it very hard to ensure data security in this interconnected world. That is why cybersecurity threats and cyberattacks are on the rise. Consequences of hacking can be huge. Further, the threat landscape has been evolving; hackers could steal not only financial data but also critical and sensitive information that could be used for criminal or extremist activities. Per Deloitte’s Q2 CFO survey, “CFOs in North America view cyberattacks as a serious threat, but many have doubts about their organization’s level of preparedness.” Surging demand for protection against these cyber threats will continue to drive demand for spending on cybersecurity. This ETF provides exposure to a diverse group of hardware and software companies in the cybersecurity industry. The product charges an expense ratio of 75 basis points. It made its debut in November last year and has already managed to gain almost $1.4 billion in assets, thanks mainly to some high profile cyberattacks of late. The ETF holds 32 securities in its portfolio and is well spread out across holdings, due to modified equal weighting methodology. Investors should however note that some of these cybersecurity stocks have been quite hot lately, leading to valuation concerns but given surging demand for these services, the ETF could be an excellent longer-term holding for investors who can ride out shorter-term volatility. The ETF is up more than 17% year-to-date. 2015 has turned out to be a pretty good year so far for hedge funds after many years of underperformance. Gains this year have been driven partly by the booming M&A activity, particularly in the healthcare sector and savvy stock selection. Most investors would like to invest like George Soros, Carl Icahn and John Paulson but the $2.9 trillion hedge fund industry is accessible only to very wealthy investors. Further, hedge fund investing is expensive as they usually charge an annual asset management fee of 2% and a performance fee of 20% of fund’s profits (2 and 2 fees). Fortunately for ordinary investors, there are some ETFs that provide access to investing secrets of such gurus, without charging the hefty fees that their funds charge. This ETF is based on the AlphaClone Hedge Fund Long/Short Index. The index uses AlphaClone’s proprietary “Clone Score” methodology to aggregate the hedge funds ideas on a quarterly basis. Clone scores, which are calculated bi-annually, are based on hedge funds managers’ performance. Index constituents are equally weighted but can have overlap bias. The index also has a hedge mechanism built in, which is triggered on or off when the S&P 500 index crosses its 200 day moving average at any month end. If the market goes down, the index goes from long-only to market hedged (50% short exposure to S&P 500). Launched in May 2012, this product has been able to attract about $195 million in assets so far. It has 86 holdings currently with Apple (NASDAQ: AAPL ), Valeant Pharmaceuticals (NYSE: VRX ) and Celgene Corp (NASDAQ: CELG ) being the top holdings. ALFA is slightly pricey, charging 95 basis points in expenses. It is up more than 8% year-to-date. Over the past three years, ALFA has climbed by 75% compared with 61% for the SPDR S&P 500 Trust ETF ( SPY). Link to the original post on Zacks.com