Tag Archives: nasdaqaapl

Let Them Eat Spreadsheets

Summary Numbers by themselves don’t tell us very much. Put another way, a text without a context can become a pretext. Because we don’t let sports teams make up their own rules as they play, we have certain standards that companies are supposed to go by when they report their earnings. Accounting isn’t “Calvinball.” By looking carefully at supporting ratios, and how they change over time, a careful analyst can sometimes sniff out whether a company’s earnings are real, or whether they’ve been enhanced by questionable accounting practices. Because financials are like a bathing suit: what they reveal is interesting, but what they conceal may be even more interesting. What good are financial statements? Most of us have a vague idea that Apple (NASDAQ: AAPL ) makes iPhones, that Panera (NASDAQ: PNRA ) runs restaurants, and that Wal-Mart (NYSE: WMT ) sells stuff. But how well do they do these things? Reports that Amazon (NASDAQ: AMZN ) earned 19 cents last quarter or that IBM (NYSE: IBM ) had sales of $20.8 billion leave us cold. Numbers by themselves don’t tell us very much. Put another way, a text without a context can become a pretext. Financial statements are intended to tell us what a company has (the balance sheet) and what the firm did with what it has (the income statement). They also disclose what management has done with its cash (the statement of cash flows). We need to know these things because ultimately any investment’s value is determined by how much cash it can generate for its investors, and how predictable (or unpredictable) this cash stream is. Because we don’t let sports teams make up their own rules as they play, we have certain standards that companies are supposed to go by when they report their earnings. Accounting isn’t ” Calvinball .” But electric utilities are different than banks, which differ from defense contractors. So management is allowed a little leeway as they apply the rules. Those choices, however, have to be reflected in the footnotes – usually “Footnote 1.” In order to make sense of the raw numbers, equity analysts use ratios to compare companies with each other. It’s notable that Apple had a 40% profit margin the last year, but that’s even more remarkable when you see that Microsoft’s (NASDAQ: MSFT ) margin was only 23%, and that Samsung’s ( OTC:SSNLF ) was just 10%. That may be one reason why Apple seems to be taking over the world. Source: Bloomberg Every year public companies have to hire outside accountants to examine their financial statements and verify that they’ve been playing by the rules. Although the financial news tends to report just one or two numbers each quarter – earnings per share and sales – there are lots and lots (and lots) of supporting statements that go into those. Businesses can be complicated, and disclosing their activities properly takes a lot of time and effort. Last year, GE’s (NYSE: GE ) annual financial statement was 247 pages long! By looking carefully at these supporting ratios, and how they change over time, a careful analyst can sometimes sniff out whether a company’s earnings are real, or whether they’ve been enhanced by questionable accounting practices. Because financials are like a bathing suit: what they reveal is interesting, but what they conceal may be even more interesting. Editor’s Note: This article discusses one or more securities that do not trade on a major U.S. exchange. Please be aware of the risks associated with these stocks. Share this article with a colleague

5 Reasons To Lower Your Allocation To Riskier Assets

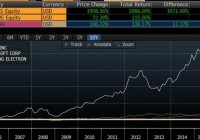
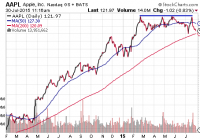
Fewer and fewer components are holding up the Dow, the S&P 500 and the NASDAQ. If foreign stocks are faltering at a time as when half of U.S. stocks are in their own downtrends, it may reasonable to assume that the major U.S. benchmarks could buckle. There are a number of headwinds that are likely to bring about a substantive correction to the Dow, S&P 500 and NASDAQ in the near-term. For months, I have been discussing the likely implications of deteriorating market breadth. For instance, fewer and fewer components are holding up the Dow, the S&P 500 and the NASDAQ. Only a small number of industry sectors are keeping the popular benchmarks in the plus column. Similarly, half of the stocks in the S&P 500 currently demonstrate bearish downtrends. And declining stock issues are significantly pressuring advancing stock issues for the first time since July of 2011. Historically, when a handful of stocks like Amazon (NASDAQ: AMZN ), Apple (NASDAQ: AAPL ), Facebook (NASDAQ: FB ), Gilead (NASDAQ: GILD ), Google (NASDAQ: GOOG ) and Walt Disney Co (NYSE: DIS ) account for all of the gains for a major index like the S&P 500 – when 250 of the index constituents show bearish patterns – the narrow breadth tends to drag the benchmark’s price downward. To be fair to the bull case, the major indices have held up so far. Nevertheless, U.S. equities in the Dow and the S&P 500 have been churning sideways for the better part of seven months. What about the prospect for underperforming sectors of the economy contributing to widespread market gains? I wouldn’t hold my breath on the possibility of wider breadth in the near term. Materials and resources-related companies continue to be plagued by slumping oil and weak commodity demand around the globe. Most economists believe that while the rout in commodities may conceivably abate, a significant increase in global demand or a sharp decline in global supply is unlikely. In the same manner, the manufacturing segment’s pullback may be structural, not cyclical. Miners, industrial conglomerates and utilities probably won’t be getting wind at their back anytime soon. For better or worse, the primary hope for continued appreciation in the U.S. indices rests atop the shoulders of the healthcare juggernaut, dot.com usage and the iPhone-oriented consumer. Indeed, investors have been remarkably willing to pay almost any price for the growth of the “Facebooks” and “Gileads” of the world. On the flip side, can the market-cap behemoths do any wrong? Of course they can. It wasn’t so long ago that Facebook shares face-planted for a 50% loss out of the IPO gate? Similarly, Apple tumbled 45% at the tail-end of 2013. Even at this moment, questions about the viability of the iWatch and the corporation’s ability to grow at a rapid pace in future quarters is keeping the shares of the largest company on the planet from breaking through resistance. For the time being, however, let’s assume that the “Big Six” identified earlier maintain their proverbial cool. And let’s assume that the narrow breadth in the U.S. benchmarks (as well as sky-high stock valuations) are not enough to dent the positive impact provided by health care and retail/consumer stocks. Is it possible that waning enthusiasm for foreign equities might couple with the weakness in U.S. market internals and sky-high valuations to eventually topple the major U.S. benchmarks? Looking back to the last stock market smack-down might provide some clues. Specifically, in 2009 and 2010, stocks throughout the world staged a revival. What’s more, in the same manner as they had in the previous decade, foreign stocks significantly outpaced U.S. stocks in 2009 and 2010. In fact, the global growth theme that dominated the initial decade of the 21st century remained in the driver’s seat. The dominance ended in October of 2010, however. Not only were the “emergers’ emerging at a slower pace, particularly China, but central bank stimulus supplanted the global growth story altogether. Consider the Vanguard FTSE All-World ex-US ETF (NYSEARCA: VEU ): SPDR S&P 500 Trust ETF (NYSEARCA: SPY ) price ratio below. VEU:SPY began descending in the 4th quarter of 2010. The fading relative strength for VEU:SPY cemented itself early in 2011, when 200-day trendline support shifted to resistance. Not only did the weakness in U.S. market internals matter in July 2011 via the NYSE Advance Decline (A/D) Line, but relative weakness in foreign stocks also mattered. Fewer and fewer U.S. stocks were participating in the rally by July of 2011 and fewer and fewer international stocks were participating in the worldwide equity rally. It is worth noting that the deterioration of the VEU:SPY price ratio over the last three months of 2015 may be another headwind to U.S. benchmark gains. Historically, all stock assets typically exhibit positive correlations. It follows that, if foreign stocks are faltering at a time as when half of U.S. stocks are in their own downtrends, it may reasonable to assume that the major U.S. benchmarks could buckle. By way of review, there are a number of headwinds that are likely to bring about a substantive correction to the Dow, S&P 500 and NASDAQ in the near-term: Federal Reserve and the Rate Hike Quagmire . By itself, a bump up in overnight lending rates may not be a big deal. Conversely, participants may perceive inaction (an unwillingness to do anything) or too much activity (back-to-back rate hikes on wishy-washy data) as a major policy mistake. Extremely High Valuations and Eroding Domestic Internals . High valuations alone can always move higher; excitement can turn to euphoria. Yet history has rarely been kind to the combination of stock overvaluation and narrowing leadership (i.e., bad breadth). Fading Effects Of Quantitative Easing/Other Stimulative Measures In Foreign Stocks . Both Europe and Japan had seen their prices surge shortly after confirmation of asset purchases. Over the last three months, those fortunes have cooled relative to the U.S. In some instances, as has been the case in China, stimulative measures that didn’t work eventually turned to direct (as opposed to indirect) market manipulation. Is the world losing faith in its central banks? The Return of Credit Risk Aversion In Bonds . Seven months into 2015 and the widely anticipated jump in 10-year yields is nowhere to be seen. In fact, the 10-year at 2.25% is roughly in the exact same place as it was when the year started. It has been lower (much lower); it has been higher, not far from 2.5%. Yet the bottom line is that treasuries via the iShares 7-10 Year Treasury Bond ETF (NYSEARCA: IEF ) is rising in relative strength when compared with a high yield bond proxy like the iShares iBoxx $ High Yield Corporate Bond ETF (NYSEARCA: HYG ). Economic Weakness in the U.S. and Across the Globe. Latin America, Asia, Europe . Name the region and the economic deterioration is palpable. In contrast, many portray the U.S. economy in a positive light. Headline unemployment is low, home prices are high and Q2 GDP at 2.3% is faster than what we witnessed in Q1. Yet labor force participation (employment) is at 1977 levels, home ownership is at the lowest levels since 1967 and GDP has grown at an anemic 2% over the last six years. That’s not what a recovery typically looks like. It is no wonder that revenue (sales) at U.S. corporations will be negative for the second consecutive quarter. And when both the quality of job growth as well as the weakness in revenues are tallied, nobody should be surprised at the snail’s pace of wage growth either (2%). In spite of parallels that one can draw between the previous correction and/or prior bear markets (e.g., eroding domestic market internals, extremely high domestic stock valuations, near-term foreign stock weakness, etc.), the observations are not synonymous with prediction of disaster; rather, the observations lead me to conclude that a reduction of risk asset ownership is warranted for tactical asset allocation strategists. Practically, then, if you typically have 65% in equity (split between foreign and domestic, large and small) and 35% in income (investment grade and high yield), you might want to reduce the overall exposure to riskier assets until a significant correction transpires. How might I do it? I might have 55% in equity (mostly large-cap domestic), 25% allocated to income (mostly investment grade) and 20% cash/cash equivalents. Not only will you have reduced the amount of equity, you will have reduced the type of equity. Not only will you have reduced the income, but you will reduced the type of income. The efforts should assist in weathering the probable storm, as well as allow one to raise risk exposure at more attractive pricing. Is it possible that a tactical asset allocation shift might move further away from riskier assets? Like 35% equity, 25% income and 40% cash/cash equivalents? Yes. However, one would need to see a further breakdown of technicals and fundamentals beforehand. Disclosure: Gary Gordon, MS, CFP is the president of Pacific Park Financial, Inc., a Registered Investment Adviser with the SEC. Gary Gordon, Pacific Park Financial, Inc, and/or its clients may hold positions in the ETFs, mutual funds, and/or any investment asset mentioned above. The commentary does not constitute individualized investment advice. The opinions offered herein are not personalized recommendations to buy, sell or hold securities. At times, issuers of exchange-traded products compensate Pacific Park Financial, Inc. or its subsidiaries for advertising at the ETF Expert web site. ETF Expert content is created independently of any advertising relationships.

Stocks Are Not Milk – So Don’t Invest Like They Are

I want to warn you about stock splits today – and to save you from getting bamboozled the next time a company splits its stock, like Netflix (NASDAQ: NFLX ) is scheduled to do next week. If you have ever gone grocery shopping, you might think you have a good understanding of stock splits. For example, I’m sure you have noticed that four one-quart containers of milk will cost you more than a one-gallon container. The milk company is able to create value by dividing the original gallon into smaller containers. But what works in the supermarket does not work on the stock market, despite the fact that many investors behave as if they believe it does. They become elated when they hear that a stock they own is about to split, because, like in our milk example, they believe that the sum of the parts will be worth more than the whole. Or they decide to buy into a stock because it is going to split, believing, again, that four quarts is worth more than one gallon. I have always found this behavior curious. After all, what’s the difference between owning 100 shares of a $100 stock and 200 shares of a $50 stock? There is no difference. Your total investment is worth $10,000 either way. The only reason to think otherwise would be if you believed that a stock would appreciate at a faster rate after a split than it would have without a split. However, there is no evidence to support this line of thinking. When managements are asked why they split their stock, they inevitably say that the price of the stock had gone up too high, making it unaffordable for many investors. By saying this, they are implying that there would be greater demand for the stock if only the price were lower. Those of us who studied Economics 101 would agree that for most goods, there is a relationship between price and demand. In general, the lower the price, the greater the demand. However, stocks are not like milk. You can’t create value out of stocks simply by dividing them into smaller units. A stock split changes the price per share, but it does not change the price of all the shares in aggregate. In other words, a stock split has no impact on the company’s market capitalization. If the company were in play, do you really believe the acquirer would pay a larger premium simply because the target split the stock? Of course not. Having said that, I must admit that there are times when stock splits make sense. For example, several decades ago, before there were discount brokerage firms, trading costs were extremely high. Furthermore, investors paid a penalty if they bought (or sold) less than a round lot (i.e., 100 shares). As a result, there was a significant monetary incentive to trade at least 100 shares at a time. That’s no longer the case. Trading commissions have been driven down significantly. If you can’t afford to buy 100 shares of a $1,000 per share stock, there is nothing preventing you from buying 50 shares or even 10 shares. For that reason alone, there is much less of a need for corporations to split stock. So are there any good reasons for a company to split stock these days? Sure. A stock split would make sense if the stock price were so high that even one share were unaffordable. Berkshire Hathaway Class A (NYSE: BRK.A ) shares sell for more than $200,000 each. There aren’t many investors who can afford that. It would certainly make sense for Berkshire to split the stock. The problem is that Warren Buffett, the chairman and CEO, vowed long ago to never split the shares. Yet, at one point, he realized he had a problem. So in order to avoid breaking his vow, he simply created a new “Class B” (NYSE: BRK.B ) type of share. For all intents and purposes, the creation of the Class B shares was equivalent to splitting the stock. Here’s another good reason for a split. Apple (NASDAQ: AAPL ) initiated a 7-for-1 stock split in June 2014, when the stock price was near $700 per share. That’s nowhere near Berkshire territory. Most investors could easily afford to buy 10 or even 20 shares of a $700 stock – so why the split? The answer became clear a few months after the split, when Apple was added to the Dow Jones Industrial Average. Unlike most market indexes, the Dow is not capitalization-weighted. It is price-weighted. In other words, the higher the price, the greater the impact on the index. There was no way the folks at Dow Jones were going to include a $700 stock in the index. By splitting the stock, Apple brought the stock price down to a level that was comparable to several of the Dow’s other components. The split made Apple eligible for membership in one of the most prestigious market indexes. Finally, there is one other valid reason why companies might want to split their stock. A stock split can be an effective way for management to signal its optimism to the market. It’s one thing for the CEO to state that he or she is bullish about the company’s prospects. It’s a completely different thing to actually signal that optimism by splitting the stock. In this case, a stock split is like putting your money where your mouth is. Management would not be likely to initiate a split if it thought the company was about to run into a rough patch. Here’s my advice on stock splits. Don’t buy a stock just because the company announces a split. A split might cause a brief rally, but there are more important factors that will have a stronger impact on the stock price over the long term. Perhaps this is best exemplified by recent events at Netflix. The company announced a 7-for-1 stock split right after the market closed on June 23. Not surprisingly, the immediate reaction was euphoric. The stock surged significantly higher in after-hours trading. Yet, by the end of the following day, shares of Netflix were trading lower, and they have continued to drift lower ever since. It turns out that Carl Icahn had liquidated his entire position in the company, suggesting he thought the shares were no longer undervalued. That’s more important than how many quarts are in a gallon.