Algorithm Aversion – Why People Don’t Follow The Model!
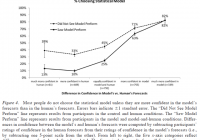
By Jack Vogel, Ph.D. There are many studies showing that models beat experts , including the meta-study ” Clinical versus mechanical prediction: A meta-analysis ” by Grove et al. (2000). However, given this knowledge that models beat experts, forecasters still prefer to use the human (expert) prediction as opposed to using the model. Why is this? A recent paper by Dietvorst et al. (2014), titled ” Algorithm Aversion: People Erroneously Avoid Algorithms After Seeing Them Err ” examines this phenomenon. Here is the abstract of the paper. Research shows that evidence-based algorithms more accurately predict the future than do human forecasters. Yet when forecasters are deciding whether to use a human forecaster or a statistical algorithm, they often choose the human forecaster. This phenomenon, which we call algorithm aversion, is costly, and it is important to understand its causes. We show that people are especially averse to algorithmic forecasters after seeing them perform, even when they see them outperform a human forecaster. This is because people more quickly lose confidence in algorithmic than human forecasters after seeing them make the same mistake. In 5 studies, participants either saw an algorithm make forecasts, a human make forecasts, both, or neither. They then decided whether to tie their incentives to the future predictions of the algorithm or the human. Participants who saw the algorithm perform were less confident in it, and less likely to choose it over an inferior human forecaster. This was true even among those who saw the algorithm outperform the human. Here is an interesting example (from the paper) to describe why this may occur: Imagine that you are driving to work via your normal route. You run into traffic and you predict that a different route will be faster. You get to work 20 minutes later than usual, and you learn from a coworker that your decision to abandon your route was costly; the traffic was not as bad as it seemed. Many of us have made mistakes like this one, and most would shrug it off. Very few people would decide to never again trust their own judgment in such situations. Now imagine the same scenario, but instead of you having wrongly decided to abandon your route, your traffic-sensitive GPS made the error. Upon learning that the GPS made a mistake, many of us would lose confidence in the machine, becoming reluctant to use it again in a similar situation. It seems that the errors that we tolerate in humans become less tolerable when machines make them. We believe that this example highlights a general tendency for people to more quickly lose confidence in algorithmic than human forecasters after seeing them make the same mistake. We propose that this tendency plays an important role in algorithm aversion. If this is true, then algorithm aversion should (partially) hinge on people’s experience with the algorithm. Although people may be willing to trust an algorithm in the absence of experience with it, seeing it perform-and almost inevitably err-will cause them to abandon it in favor of a human judge. This may occur even when people see the algorithm outperform the human. The paper goes on to show that as human confidence in the model increases, humans are more likely to use the model (even if they have viewed the model and have seen it fail). This is described in the figure below. (click to enlarge) Source: “Algorithm Aversion: People Erroneously Avoid Algorithms After Seeing Them Err” by Dietvorst et al. (2014) However, note that even when people have “much more” confidence in the models, around 18% of people still use the human prediction! We are a firm that believes in evidence-based investing and understand that (in general) models beat experts . However, most people prefer the human option after seeing a model (inevitably) fail at some point in time. How does this tie to investing? If we are trying to beat the market through security selection, an investor has three options: use a model to pick stocks, use a human, or combine the two. Inevitably, the model will underperform at some point, since no strategy wins all the time (if a strategy never failed, everyone would invest and the edge would cease to exist). When a model underperforms for a certain time period, it does not mean that the model is inherently broken. In fact, the model could have simply failed over some time period, but the long-term statistical “strength” of the model remains intact. Steve, the human stock-picker, will also under-perform at some point; however, Steve can probably tell a better story over a beer as to why he missed the mark on last quarter’s earnings, that pesky SEC investigation, etc. And since drinking a beer with stock-picker Steve is a lot more fun than drinking a beer with an HP desktop, we will probably give Steve the benefit of the doubt. Successful investors understand that models will fail at times; however, being able to stick with the model through thick and thin is a good strategy for long-term wealth creation. For the rest of us, there’s always stock-picker Steve. Cheers. Original Post