Tag Archives: pro

Is FirstEnergy’s Rally Driven By Low U.S. Treasury Yields?

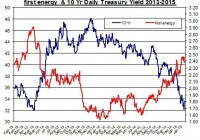
Summary FirstEnergy’s stock added nearly 30% in the past six months. Have low U.S. treasury yields increased the demand for FirstEnergy? What are the other factors that could also drive up shares of FirstEnergy? Shares of FirstEnergy (NYSE: FE ) have added nearly 30% to their value in the past six months. The common notion is that falling U.S. treasury yields tend to increase the demand for utility companies such as FirstEnergy. But is this the case? Also, what are some of the other factors that could drive up the price of FirstEnergy? Do U.S. treasury yields matter? To answer this question, let’s examine the relation of the 10 year treasury yield and the movement in FirstEnergy’s stock over the last couple of years. Source of data taken from Google Finance and U.S. Treasury At first glance we can see in times when treasury yields have gone down, as was the case in recent months, the stock of FirstEnergy rallied and vice versa. But after reviewing the linear correlation between the two sets of data – the correlation for the period was only -0.05 – it’s harder to make the case for a strong relation between U.S. treasury yields and FirstEnergy. But still the relation could be more a matter of people slowly moving their funds to utility companies such as FirstEnergy rather than having a direct clear cut reaction to these changes in the market. In other words, the relation could be more in the trend line than in the day to day shifts. This could all change if the FOMC were to start to raise its cash rate in the second half of the year, which should increase treasury yields. One of the main reasons people like to invest in utility companies such as FirstEnergy is for its stability and relatively high yields. The current annual dividend yield is 3.6%. In comparison, Exelon (NYSE: EXC ) and Duke Energy (NYSE: DUK ) also offer similar dividend yields of 3.4% and 3.7%, respectively. But these factors aren’t the only reasons for the higher demand for FirstEnergy. Here are a few of more reasons to consider: The company is also aiming to expand its operations: FirstEnergy is in the midst of a potential of $7 billion investment in transmission across 24,000 mile transmission system in its Regulated Transmission segment – which transmits electricity through transmission facilities. Back in 2014 the company allocated $4.2 billion for this investment, which is expected to conclude in 2017 and result in the upgrade and expansion of the transmission system. For 2014, the company estimated capex for this project to reach $1.35 billion. These investments will be funded via debt, issuing stocks, employment benefits and cash. Electricity generation is expected to rise in 2015 Based on the latest report by the Energy Information Administration , consumption of electricity in the residential sector is expected to slightly decline by 0.3% in 2015, year over year. This is mainly due to 12% drop in heating degree days this year compared to 2014. Despite the lower demand for electricity in the residential sector, electricity generation is still projected to rise by 1.1% in 2015. Moreover, the EIA also estimates retail residential prices to rise by 1.1% in 2015. This could suggest higher revenue for utility companies such as FirstEnergy. The company will release its fourth quarter report at the end of February, in which the company may provide an update on its guidance for 2015. Lower coal and natural gas prices Another thing that plays in favor for FirstEnergy is the currently low coal and natural gas prices. The company’s fuel mix includes 57% coal and 8% natural gas. The current price of coal (Central Appalachian) is around $46 per short ton – back in early 2014 the price was close to $60 per short ton. Moreover, natural gas is roughly $2.6. In comparison, back in February 2014 the price of natural gas was over $5. The low energy prices are likely to improve FirstEnergy’s profit margin in the first quarter of 2015 and subsequent quarters, assuming coal and natural gas prices remain at their current low levels. Takeaway FirstEnergy is benefiting from low energy prices, falling U.S. treasury yields and potential rise in retail prices in the coming months. These factors are likely to keep the company an interesting investment opportunity. Disclosure: The author has no positions in any stocks mentioned, and no plans to initiate any positions within the next 72 hours. (More…) The author wrote this article themselves, and it expresses their own opinions. The author is not receiving compensation for it (other than from Seeking Alpha). The author has no business relationship with any company whose stock is mentioned in this article.

Top-Ranked ETF Wealth-Builders Now

Summary ETFs provide diversification defenses against specific-issue calamity, while providing thematic focus on general investment opportunity notions – maybe good reward~risk tradeoff. Same argument for leveraged long broad-market ETFs. Using wealth-building objective strategy to rank ETFs provides ability to compare attractiveness of many, varied investing themes at one point in time. Here are 30+ ETFs at present price-based Market-Maker expectations for coming prices put to such a comparison. What is the wealth-building strategy? An active-investment one, minimizing required capital holding periods while seeking high odds for profitable outcomes. It is based on prior experience of applying the strategy, which pits Market-Maker [MM] upside price change prospects, derived from their specific issue hedging actions, against worst-case price drawdown encounters. All prior forecasts with price upside to downside outlooks like the present are subjected to a regimen of buy at the next market day close and sell upon reaching the forecast upside price, or no later than 3 months after the forecast day, regardless of gain or loss. The ranking requires at least a two to five year daily history of forecast price ranges and observes the frequency of profitable results of the regimen described above on all forecasts like today’s. The win-loss ratio proportions are applied to the upside price change forecast and the average worst-case price drawdowns encountered during prior holding periods. That net reward-minus-risk result is multiplied by the number of prior forecasts to get a figure of merit for ranking purposes. This proof-of-the-pudding approach keeps our taste restricted strictly to the objective of accumulating capital in the most time-efficient way. The following picture shows how the upside forecast rewards (horizontal green scale) compare to the historical risk exposures (vertical red scale) for over 30 best-ranked ETFs at last night’s close. Figure 1 (used with permission) The R~R map’s identity numbering has no particular significance. The presence of leveraged long market indexes is notable. Among ETFs their leverage is clearly a plus. The diversity of focus among the top ETFs is instructive: But there are other dimensions that matter. Here in ranked order are their details: Figure 2 (click to enlarge) The table of Figure 2 takes on the format of our daily “topTen” ranking of all 2500 or so stocks, indexes and ETFs that provide sufficient hedging data to reasonably imply the price ranges justifying the price protection being bought by market-makers. The averages rows in blue at the bottom of Figure 2 are to offer perspective of how these 30 “best” ETFs compare with other market investment alternatives at present. Of the daily overall rankings, today’s other 20 best have substantially stronger upside prospects (6) of 11 1/2%, compared to the ETFs +7.2%. But the ETFs demonstrate shorter average holding times (10) needed to reach sell targets, about 6 weeks, compared to 7 weeks for the best single-company securities, and 9+ weeks for the entire population and the usual market-metric of the S&P 500, the SPDR S&P 500 Trust ETF (NYSEARCA: SPY ). But both “best” lists average wins in 9 out of ten prior commitments following prior forecasts like today’s. Please remember that this is not a durable appraisal of long-term prospects for these securities. Instead, it is a scorecard, of the moment, of the likelihood of market-price movements in coming days, weeks and a few months, as seen by investment professionals with fairly short time horizons. The rankings can be impacted heavily by current market price changes, and will certainly be different a week from now. By design of strategy, none of these ETFs purchased tomorrow should still be still among holdings the first week of May, and many will have had two closeouts of the employed capital in that period. The price range forecasts in the first two data columns (2) and (3) of Figure 2 set the balance of upside to downside price change prospects shown in (7). The selection of prior forecasts with similar balance (12) is where the historic norms in (8) through (11) come from. The ranking is scored in (15), with other qualitative measures in (13) and (14). Conclusion All 30 of these ETFs have good wealth-building promise at this point, with strengths in different dimensions which may have particular preferencing appeal for different investors. But for all those with a wealth-building objective, the strategy is continuing, repetitive, active investing attention, in a series of small bites with a high percentage of profitable transactions to a small proportion of unsatisfactory ones. Careful management of time invested, along with capital, is what produces growth at rates often regarded by the less careful as impossible to achieve without taking dangerous risks. Quite the contrary, the growth comes from having an informed perspective and a solid, active discipline within which to monitor and continually renew accomplishments. Disclosure: The author has no positions in any stocks mentioned, and no plans to initiate any positions within the next 72 hours. (More…) The author wrote this article themselves, and it expresses their own opinions. The author is not receiving compensation for it (other than from Seeking Alpha). The author has no business relationship with any company whose stock is mentioned in this article.

Bill Gross Has Started To Sell His Pimco Closed-End Funds

Summary This week there have been a few SEC Filings with Pimco Fund Sales. Thus far only three funds have been partially sold. The selling may provide a good buying opportunity at some point. I have previously written some articles describing Bill Gross purchases or sales of Pimco closed-end funds. While he worked at Pimco, Mr. Gross often supported Pimco’s CEFs with his personal money. There was also “copycat” buyers who often followed Mr. Gross into some of these issues. Bill Gross resigned from Pimco on September 26. Since then, closed-end fund investors have been wondering whether or not Mr. Gross would sell some or all of his Pimco CEF holdings. This week we finally started to see some SEC filings with sales of Pimco CEFs from Mr. Gross. These are the first trades since Mr. Gross resigned from Pimco in September. There is normally a two day filing delay, so the filings for February 5 show the trades done on February 3. It remains to be seen whether the selling is completed, but in the past, buying or selling often continued for a week or longer. Shares Tkr Sell Date Average Price $ Realized Discount/Premium (Feb. 5) 50,000 PDI 3-Feb 30.2641 $1,513,205 -0.8% 32,733 PDI 2-Feb 30.304 $991,941 6,630 PTY 2-Feb 16.7823 $111,267 +19.2% 22,649 PCN 3-Feb 15.3397 $347,429 +4.2% 29,200 PCN 2-Feb 15.3856 $449,260 Bill Gross owns several Pimco closed-end funds that hold tax free municipal bonds. PCQ and PZC hold tax free bonds from the state of California. Even though his new employer, Janus Capital Group, has headquarters based in Colorado, Mr. Gross has arranged to work out of an office in California. For this reason, I expect he will likely hold onto his California muni bond funds. Some of his other national muni bond fund positions may be sold depending on their cost basis to be replaced with similar funds from Janus. One fund that Mr. Gross has not sold yet that still looks fairly attractive is PCI. I’ve included some summary data for PCI below. But keep in mind that Mr. Gross currently owns about 2.4 million shares of PCI, so if he ever did decide to sell PCI, there could be quite an overhang. Pimco Dynamic Credit Income (NYSE: PCI ) -pays monthly Total Assets= 5,717 MM Total Common Assets= 3,096 MM Annual Distribution (Market) Rate= 9.12% Latest Monthly Distribution= 0.1563 (annual= $1.8756) Average Monthly Earnings per Share= $0.1804 (as of 06/30/2014) Fund Baseline Expense ratio= 1.30% Discount to NAV= -8.9% Average Six Month Discount= -8.8%% Effective Leverage: 46% Average Daily Volume: 712,000 Average $ Volume: 14.6MM Manager: Dan Ivascyn + team Disclosure: The author is long PCI. (More…) The author wrote this article themselves, and it expresses their own opinions. The author is not receiving compensation for it (other than from Seeking Alpha). The author has no business relationship with any company whose stock is mentioned in this article. Are you Bullish or Bearish on ? Bullish Bearish Neutral Results for ( ) Thanks for sharing your thoughts. Submit & View Results Skip to results » Share this article with a colleague