Tag Archives: nysearcalqd

Frustrated Yet?

The last year has been a tough one for investors. There are a few places one could have booked a double-digit gain in the last 12 months but not many and certainly not in assets that are in the standard portfolio. Currency hedged ETFs for European and Japanese stocks produced big gains, but a lot of the gain was from nothing but currency movements. And most investors shouldn’t be trying to make their yearly return punting on currencies. Stocks for the most part have been disappointing with Nasdaq as a notable exception. Notable because a lot of the action there is reminiscent of the last time that index was leading the market back in 1999/2000. The recent big moves in Google (NASDAQ: GOOG ) (NASDAQ: GOOGL ), Netflix (NASDAQ: NFLX ) and Amazon (NASDAQ: AMZN ) – based on not much – provided a eerie sense of deja vu for anyone who lived through that giddy time. The S&P 500 over the last six months is barely positive, up about 2% (or it is as I write this Friday afternoon; but if things keep going in the current direction, that could be a lot closer to 0 by the close). The average doesn’t do justice to what is really going on though. Only about half the stocks in the S&P 500 are trading above their 200-day moving average right now. Even for an index like the Nasdaq that has performed pretty well this year, less than half the stocks in the index are still in uptrends, trading above their 200-day MA. These are capitalization weighted indexes and at least right now, size does seem to matter. A similar message is sent by the advance/decline stats which show the decliners winning by a pretty wide margin. New highs/new lows also looks less than healthy with new highs increasingly scarce. So the internals of the stock market are deteriorating notably, something that doesn’t generally bode well for the immediate future for stock prices. There are other signs of stress as well. Junk bonds essentially peaked almost a year ago in price and have been trading sideways with a downward bias which has recently accelerated. With Treasuries generally well bid all week, the spread between junk and Treasury yields widened on the week, continuing the longer-term trend that started last summer and reversing the shorter-term narrowing trend that started at the beginning of this year. Credit spreads are highly correlated with the stock market, so ignore the junk market at your portfolio’s peril. Other signs of stress have emerged over the last couple of weeks. Commodities have resumed their downtrend and unlike some other recent periods, it isn’t just a function of a rising dollar. The dollar has been fairly steady but was down last week even as gold and other commodities plumbed new lows for the move. Oil is breaking toward its lows and that is undoubtedly the source of at least some of the selling in the junk bond market. The fracking companies are still struggling and lower prices aren’t going to help them make their interest payments now that their hedges are expiring. The Treasury market also is pointing to some stress with inflation and growth expectations both falling a bit recently. The frustration of the diversified investor actually goes back quite a bit further than the last 6 months or last year. If you have been following an investment plan that includes international stocks and bonds, a smattering of commodities and/or anything else that isn’t US stocks, your personal pain is now running into more like two years and maybe a bit more. I track a long list of passive portfolios and many of the globally diversified ones are working on their third consecutive year of low-to-mid single-digit returns – assuming this year turns out to have a positive number. It isn’t just the US stock indexes that have been narrowing; it is the entire investment universe. This winnowing of the investment universe to a few winners, turning diversification into a risk factor, is just one more example of the negative consequences of the modern form of economics in which common sense has been relegated to quaint notion and nonsense elevated to learned discourse. It is an Orwellian discipline where borrowing and spending have replaced thrift and investment as the drivers of economic growth, prudence is punished, speculation celebrated and rewarded. Is it any wonder that our economy continues to struggle when we’ve spent decades urging the population to be irresponsible, to ignore the future so that our present can be more comfortable? Monetary policy is a cudgel, a blunt tool used for more than a mere nudge, to make investors feel obliged to chase returns, to take excessive risks to achieve even their mundane goals. If you can’t achieve those goals with safe investments – and economic policy has made that nigh on impossible – you move out on the risk scale until you can because the alternative – spending less, saving more – has been deemed un-American, economically unpatriotic. The unspoken agreement – unspoken by the Fed certainly but widely accepted and believed – is that the monetary powers that be will maintain risky assets at the high prices that have, according to the Fed, produced or at least enhanced whatever meager recovery we’ve had since 2009. A permanently high plateau , if you will. The problem is that this unspoken agreement, this economic wink and a nod, has produced moral hazard on an epic scale. People do stupid things when they think their rewards are deserved and any losses will be absorbed or prevented by others. If you doubt that, just take a few moments to remember the structure of the mortgage system that produced the last crisis. It was a system where government policy didn’t just implicitly relieve lenders of the risks of their loans, they did it explicitly by either guaranteeing the loans or buying them outright. Now we apply that lesson to all investors, the Fed equally concerned about the stock index and the price index. It has “worked” so far in that risky asset prices are high but the economic payoff is less clear. It may be that the US and global economy is better off today than it would have been without the exertions of the world’s central bankers, but you’d be hard pressed to prove it. Considering the moral lessons being taught by these policies one can’t help but wonder if the gains are worth the potential losses. Markets, individuals, will eventually see through the Fed’s illusion of control and mark assets to a real market. The list of winning investments – risky investments – has been pared down to just a few over the last two years and the list gets shorter every day. Most recently the junk bond market has been quietly deleted or at least partially erased from the winners list. With oil prices falling again, the fracking companies bankers are balking of course, but it isn’t just energy companies that are being denied financing. Several deals have been canceled recently that had nothing to do with fracking. And it isn’t just junk bonds that are getting marked down; the high grade corporate bond ETF (NYSEARCA: LQD ) has actually performed worse than its junk bond cousin over the last six months. You certainly can’t call it a credit crunch yet but the new normal economy may not need a full blown crunch to fall into recession. It is a frustrating time for investors and one that is fraught with danger. The risk isn’t from without, from some unknown black swan, but rather from within, from ourselves, the self-inflicted financial wound caused by greed and the very American desire to win, to do better than the next guy. It is tempting to discard the investment methods that have withstood the test of time in favor of the fad of the moment, the church of what’s working now. But in every investment cycle there comes a time when winning is accomplished by not losing, by ignoring the sirens of risk and lashing oneself to the mast of safety. Now would seem a good time to at least find the rope.
Harvesting Higher Yields With The Fallen Angel Bond ETF

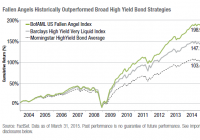
Summary High-yield bonds have attracted significant investor attention in the current yield-starved environment. However, lower quality credit is usually associated with higher volatility and risk compared to investment grade credit. Can fallen angels capture the best of both words? This article seeks to compare the fallen angel bond ETF ANGL with three other U.S. corporate bond ETFs: LQD, JNK and HYG. Introduction The low interest rate environment that has prevailed for the past few years has shifted significant investor attention towards a range of income-generating securities, such as dividend stocks, REITS, MLPs, BDCs and high-yield bonds. Within the realm of high-yield bonds, the two largest U.S. high-yield bond ETFs are the iShares iBoxx $ High Yield Corporate Bond ETF (NYSEARCA: HYG ) and the SPDR Barclays High Yield Bond ETF (NYSEARCA: JNK ), which have attracted around $14B and $10B in assets, respectively. However, high-yield bonds, due to their lower credit quality have also historically been associated with increased volatility and risk compared to investment grade bonds (see the iShares iBoxx $ Investment Grade Corporate Bond ETF (NYSEARCA: LQD ), which has $21B in assets). Not surprisingly, this leads to a common investor dilemma: should one go for the increased yield but higher risk of junk bonds, or the increased safety but lower yield of investment grade bonds? And is it possible to have some of both? Fallen angels Fallen angel bonds are those that were rated as investment grade when issued, but were then subsequently downgraded to non-investment grade status. Consequently, fallen angel bonds typically occupy the higher rungs (i.e., BB) of the non-investment grade bond credit ladder. The fall of a company from investment grade to non-investment grade status, sometimes due to a ratings cut of as little as one notch, can significantly impact the perceived risk and hence valuation of the company’s debt and equity. These bonds instantly become subjected to forced and indiscriminate selling by fund managers or indices that do not allow junk debt in their investment mandates. This can lead to substantial mispricing which therefore can create value in these bonds. According to data provided by the fund website , fallen angel bonds have outperformed high-yield bonds for 8 out of 11 calendar years since 2004, and with superior risk-adjusted returns to boot. The Market Vectors Fallen Angel Bond ETF (NYSEARCA: ANGL ) aims to capture the outperformance of fallen angel bonds. This fund appears to be little-known, with only 76 followers on Seeking Alpha. This article seeks to compare ANGL with three other U.S. corporate bond ETFs, LQD, JNK and HYG to evaluate the performance of the fallen angel ETF since inception and whether or not it has performed as expected. Credit profile The following table provides data for the credit quality distribution of these four funds (data from fund websites). ANGL LQD JNK HYG AAA – 1.7 – – AA – 10.82 – – A 0.64 47.86 – – BBB 1.56 38.25 – 2.29 BB 76.9 – 42.06 48.14 B 14.13 – 44.15 39.47 CCC 6.98 – 13.79 9.18 This data is also presented graphically. We can see from the data above that the majority of ANGL’s holdings are in BB bonds. LQD obviously contains only investment grade bonds, while JNK and HYG both only contain non-investment grade bonds. JNK and HYG appear to have a similar overall credit quality, with JNK having fewer BB bonds but more CCC bonds. Performance The following chart shows the performance of the four funds over the past 4 years (since inception of ANGL). ANGL Total Return Price data by YCharts We can see from the data above that ANGL has had the highest performance of 29.07% over the past four years. The two high-yield bond funds, JNK and HYG, had total return performances of 21.33% and 21.76%, respectively, while LQD had the lowest total return of 13.08%. The following table illustrates further performance metrics for the four bond funds. Data are from Morningstar, and return figures are annualized. Metric ANGL LQD JNK HYG Return (3Y) 9.98 4.41 7.08 7.04 Return (5Y) – 6.54 7.16 8.37 Return (10Y) – 5.41 – – Volatility (3Y) 4.34 5.22 4.91 4.59 Volatility (5Y) – 5.21 8.48 6.65 Volatility (10Y) – 7.07 – – Sharpe ratio (3Y) 2.21 0.84 1.41 1.50 Sharpe ratio (5Y) – 1.23 1.17 1.24 Sharpe ratio (10Y) – 0.58 – – We can see that over the past three years, ANGL not only had the highest return out of the four bond funds, but is also had the lowest volatility as well. This is surprising because one might have expected the ANGL to possess increased volatility compared to the investment grade bond fund LQD. The lowest volatility and highest return of ANGL causes the fund to exhibit a Sharpe ratio (2.21) that is significantly higher than the three other bond funds. This indicates that ANGL has exhibited the best risk-adjusted performance of the four funds ove the past three years. Fund data Relevant data for the funds are shown below and are from Morningstar . ANGL LQD JNK HYG Yield [ttm] 5.18% 3.37% 5.77% 5.37% Expense ratio 0.40% 0.15% 0.40% 0.50% Inception Apr. 2010 Jul. 2002 Oct. 2007 Apr. 2007 Assets $36.7M $20.8B $10.1B $5.37B Avg Vol. 8.7K 2.2M 6.8M 6.1MM No. holdings 173 1,371 801 1,010 Annual turnover 35% 9% 30% 11% Average maturity 10.17 12.21 6.34 4.93 Concluding thoughts In my opinion, ANGL is an excellent bond ETF that can form a core part of a well-diversified portfolio. It currently yields 5.18%, which is around 180 basis points greater than the investment grade bond fund LQD (3.37%) . Additionally, its yield is only 20 to 50 basis points less than that of JNK (5.77%) and HYG (5.37%), which are significantly “junkier” than ANGL. Additionally, its expense ratio is reasonable at 0.40%, which is the same as that for JNK and 0.10% cheaper than that for HYG. Importantly, fallen angel bonds have outperformed high-yield bonds on a risk-adjusted performance for 11 years (index performance), and for at least four years over both high-yield bonds and investment grade bonds (live ETF performance). Additionally, I believe that the mispricing that occurs upon the downgrading of a bond into non-investment grade status is an anomaly that should continue to persist into the future. The AUM of ANGL is only $36.7M, which is less than 1% that of the other three funds, but I expect this figure to rise as the performance of the fund becomes better known. However, this does lead to a trading low volume of 8.7K shares for ANGL, which may result in higher bid-ask spreads for investors. Additionally, the maturity of ANGL is at 10.17 years, which is lower than for LQD (12.21) but significantly higher than for JNK (6.34) and HYG (4.93). This suggests that ANGL might be more interest-rate sensitive than JNK and HYG. Surprisingly, however, ANGL has avoided damage from the mini-“Taper tantrum” of 2015 so far, posting even better total return performances compared to the lower-maturity funds JNK and HYG, while LQD has predictably slid. ANGL Total Return Price data by YCharts Disclosure: I am/we are long ANGL. (More…) I wrote this article myself, and it expresses my own opinions. I am not receiving compensation for it (other than from Seeking Alpha). I have no business relationship with any company whose stock is mentioned in this article.

ETFReplay.com Portfolio For January

The ETFReplay.com Portfolio holdings have been updated for January 2015. I previously detailed here and here how an investor can use ETFReplay.com to screen for best performing ETFs based on momentum and volatility. The portfolio begins with a static basket of 15 ETFs. These 15 ETFs are ranked by 6 month total returns (weighted 40%), 3 month total returns (weighted 30%), and 3 month price volatility (weighted 30%). The top 4 are purchased at the beginning of each month. When a holding drops out of the top 5 ETFs, it will be sold and replaced with the next highest ranked ETF. Starting in 2015, the basket of 15 ETFs will be reduced to 14 in order to further simplify the strategy. PowerShares DB Agricultural Commodities (NYSEARCA: DBA ) has been removed. The 14 ETFs are listed below: Symbol Name RWX SPDR DJ International Real Estate PCY PowerShares Emerging Mkts Bond WIP SPDR Int’l Govt Infl-Protect Bond EFA iShares MSCI EAFE HYG iShares iBoxx High-Yield Corp Bond EEM iShares MSCI Emerging Markets LQD iShares iBoxx Invest Grade Bond VNQ Vanguard MSCI U.S. REIT TIP iShares Barclays TIPS VTI Vanguard MSCI Total U.S. Stock Market DBC PowerShares DB Commodity Index GLD SPDR Gold Shares TLT iShares Barclays 20+ Year Trsry SHY iShares Barclays 1-3 Year Treasry Bnd Fd In addition, ETFs must be ranked above the cash-like ETF SHY in order to be included in the portfolio, similar to the absolute momentum strategy I profiled here . This modification could help reduce drawdowns during periods of high volatility and/or negative market conditions (see 2008-2009), but it could also reduce total returns by allocating to cash in lieu of an asset class. The top 4 ranked ETFs based on the 6/3/3 system as of 12/31/14 are below: 6mo/3mo/3mo TLT iShares Barclays Long-Term Trsry LQD iShares iBoxx Invest Grade Bond VNQ Vanguard MSCI U.S. REIT SHY Barclays Low Duration Treasury For January, 50% of our current position in SHY will be sold and the proceeds used to purchase VNQ. The strategy continues to hold TLT, LQD, and a reduced position in SHY. Beginning in 2014, we track both the 6/3/3 strategy (same system as 2013) as well as the pure momentum system, which will rank the same basket of 15 (now 14) ETFs based solely on 6 month price momentum. There is no cash filter in the pure momentum system, volatility ranking, or requirement to limit turnover – the top 4 ETFs based on price momentum will be purchased each month. The portfolio and rankings will be posted on the same spreadsheet as the 6/3/3 strategy. The top 4 six month momentum ETFs are below: 6 month Momentum TLT iShares Barclays Long-Term Trsry VNQ Vanguard MSCI U.S. REIT VTI Vanguard Total U.S. Stock Market LQD iShares iBoxx Invest Grade Bond The 6 month momentum system maintains positions in TLT, VNQ, and VTI. PCY will be sold and the proceeds used to purchase LQD. Below is a 2-year equity curve for the conservative strategy: (click to enlarge) Below is a 1-year equity curve for the aggressive strategy: (click to enlarge) Disclosures: None