Scalper1 News
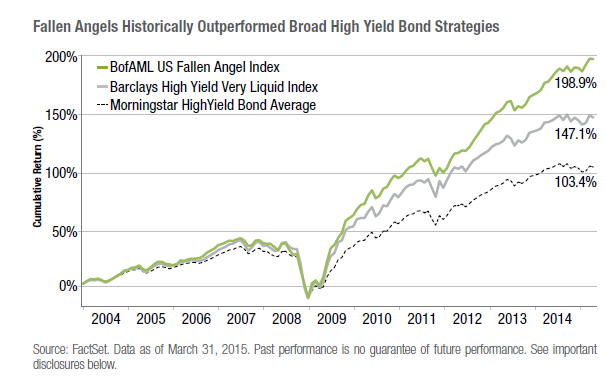
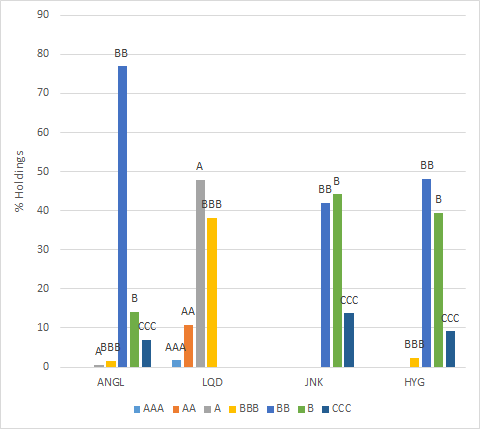
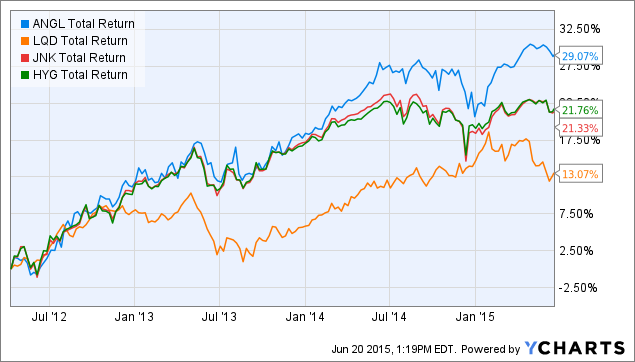
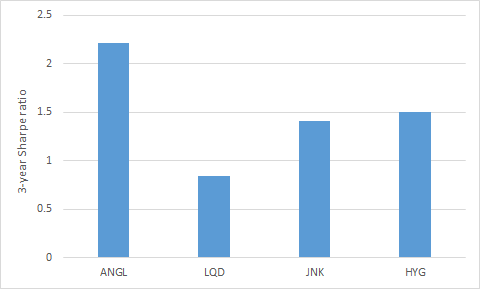
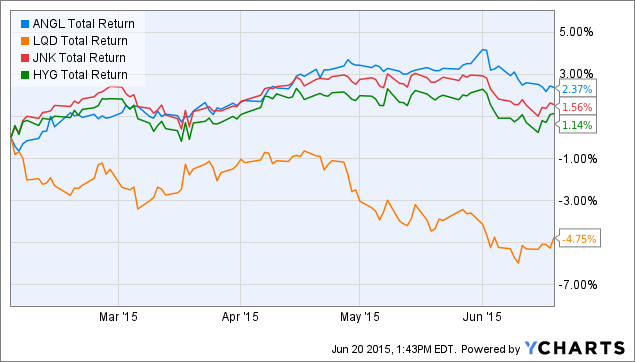 Summary High-yield bonds have attracted significant investor attention in the current yield-starved environment. However, lower quality credit is usually associated with higher volatility and risk compared to investment grade credit. Can fallen angels capture the best of both words? This article seeks to compare the fallen angel bond ETF ANGL with three other U.S. corporate bond ETFs: LQD, JNK and HYG. Introduction The low interest rate environment that has prevailed for the past few years has shifted significant investor attention towards a range of income-generating securities, such as dividend stocks, REITS, MLPs, BDCs and high-yield bonds. Within the realm of high-yield bonds, the two largest U.S. high-yield bond ETFs are the iShares iBoxx $ High Yield Corporate Bond ETF (NYSEARCA: HYG ) and the SPDR Barclays High Yield Bond ETF (NYSEARCA: JNK ), which have attracted around $14B and $10B in assets, respectively. However, high-yield bonds, due to their lower credit quality have also historically been associated with increased volatility and risk compared to investment grade bonds (see the iShares iBoxx $ Investment Grade Corporate Bond ETF (NYSEARCA: LQD ), which has $21B in assets). Not surprisingly, this leads to a common investor dilemma: should one go for the increased yield but higher risk of junk bonds, or the increased safety but lower yield of investment grade bonds? And is it possible to have some of both? Fallen angels Fallen angel bonds are those that were rated as investment grade when issued, but were then subsequently downgraded to non-investment grade status. Consequently, fallen angel bonds typically occupy the higher rungs (i.e., BB) of the non-investment grade bond credit ladder. The fall of a company from investment grade to non-investment grade status, sometimes due to a ratings cut of as little as one notch, can significantly impact the perceived risk and hence valuation of the company’s debt and equity. These bonds instantly become subjected to forced and indiscriminate selling by fund managers or indices that do not allow junk debt in their investment mandates. This can lead to substantial mispricing which therefore can create value in these bonds. According to data provided by the fund website , fallen angel bonds have outperformed high-yield bonds for 8 out of 11 calendar years since 2004, and with superior risk-adjusted returns to boot. The Market Vectors Fallen Angel Bond ETF (NYSEARCA: ANGL ) aims to capture the outperformance of fallen angel bonds. This fund appears to be little-known, with only 76 followers on Seeking Alpha. This article seeks to compare ANGL with three other U.S. corporate bond ETFs, LQD, JNK and HYG to evaluate the performance of the fallen angel ETF since inception and whether or not it has performed as expected. Credit profile The following table provides data for the credit quality distribution of these four funds (data from fund websites). ANGL LQD JNK HYG AAA – 1.7 – – AA – 10.82 – – A 0.64 47.86 – – BBB 1.56 38.25 – 2.29 BB 76.9 – 42.06 48.14 B 14.13 – 44.15 39.47 CCC 6.98 – 13.79 9.18 This data is also presented graphically. We can see from the data above that the majority of ANGL’s holdings are in BB bonds. LQD obviously contains only investment grade bonds, while JNK and HYG both only contain non-investment grade bonds. JNK and HYG appear to have a similar overall credit quality, with JNK having fewer BB bonds but more CCC bonds. Performance The following chart shows the performance of the four funds over the past 4 years (since inception of ANGL). ANGL Total Return Price data by YCharts We can see from the data above that ANGL has had the highest performance of 29.07% over the past four years. The two high-yield bond funds, JNK and HYG, had total return performances of 21.33% and 21.76%, respectively, while LQD had the lowest total return of 13.08%. The following table illustrates further performance metrics for the four bond funds. Data are from Morningstar, and return figures are annualized. Metric ANGL LQD JNK HYG Return (3Y) 9.98 4.41 7.08 7.04 Return (5Y) – 6.54 7.16 8.37 Return (10Y) – 5.41 – – Volatility (3Y) 4.34 5.22 4.91 4.59 Volatility (5Y) – 5.21 8.48 6.65 Volatility (10Y) – 7.07 – – Sharpe ratio (3Y) 2.21 0.84 1.41 1.50 Sharpe ratio (5Y) – 1.23 1.17 1.24 Sharpe ratio (10Y) – 0.58 – – We can see that over the past three years, ANGL not only had the highest return out of the four bond funds, but is also had the lowest volatility as well. This is surprising because one might have expected the ANGL to possess increased volatility compared to the investment grade bond fund LQD. The lowest volatility and highest return of ANGL causes the fund to exhibit a Sharpe ratio (2.21) that is significantly higher than the three other bond funds. This indicates that ANGL has exhibited the best risk-adjusted performance of the four funds ove the past three years. Fund data Relevant data for the funds are shown below and are from Morningstar . ANGL LQD JNK HYG Yield [ttm] 5.18% 3.37% 5.77% 5.37% Expense ratio 0.40% 0.15% 0.40% 0.50% Inception Apr. 2010 Jul. 2002 Oct. 2007 Apr. 2007 Assets $36.7M $20.8B $10.1B $5.37B Avg Vol. 8.7K 2.2M 6.8M 6.1MM No. holdings 173 1,371 801 1,010 Annual turnover 35% 9% 30% 11% Average maturity 10.17 12.21 6.34 4.93 Concluding thoughts In my opinion, ANGL is an excellent bond ETF that can form a core part of a well-diversified portfolio. It currently yields 5.18%, which is around 180 basis points greater than the investment grade bond fund LQD (3.37%) . Additionally, its yield is only 20 to 50 basis points less than that of JNK (5.77%) and HYG (5.37%), which are significantly “junkier” than ANGL. Additionally, its expense ratio is reasonable at 0.40%, which is the same as that for JNK and 0.10% cheaper than that for HYG. Importantly, fallen angel bonds have outperformed high-yield bonds on a risk-adjusted performance for 11 years (index performance), and for at least four years over both high-yield bonds and investment grade bonds (live ETF performance). Additionally, I believe that the mispricing that occurs upon the downgrading of a bond into non-investment grade status is an anomaly that should continue to persist into the future. The AUM of ANGL is only $36.7M, which is less than 1% that of the other three funds, but I expect this figure to rise as the performance of the fund becomes better known. However, this does lead to a trading low volume of 8.7K shares for ANGL, which may result in higher bid-ask spreads for investors. Additionally, the maturity of ANGL is at 10.17 years, which is lower than for LQD (12.21) but significantly higher than for JNK (6.34) and HYG (4.93). This suggests that ANGL might be more interest-rate sensitive than JNK and HYG. Surprisingly, however, ANGL has avoided damage from the mini-“Taper tantrum” of 2015 so far, posting even better total return performances compared to the lower-maturity funds JNK and HYG, while LQD has predictably slid. ANGL Total Return Price data by YCharts Disclosure: I am/we are long ANGL. (More…) I wrote this article myself, and it expresses my own opinions. I am not receiving compensation for it (other than from Seeking Alpha). I have no business relationship with any company whose stock is mentioned in this article. Scalper1 News
Scalper1 News