Tag Archives: nysearcaedv

Best And Worst ETFs Of January

The year 2015 began on quite a volatile note and in fact saw the worst start to the New Year since 2008. Standard & Poor’s 500 index fell 3.1% in January while the Dow Jones Industrial Average lost 3.7% – marking its biggest monthly loss in a year. Concerns about the impact of a stronger dollar and lower oil prices on corporate earnings growth continued to bother investors. Moreover, global growth uncertainty also played foul with both the World Bank and International Monetary Fund having slashed their global growth forecasts. The three factors – oil, the strengthening U.S. dollar and lackluster global economic growth – worked in tandem pushing down corporate profitability for Q4 and the estimates for the current and subsequent quarters. Meanwhile, the Swiss National Bank dropped its long-standing exchange rate of the Swiss franc against the euro adding to the current market volatility. At the same time, the political situation in Greece worsened as the Syriza party won the country’s general elections, raising worries about Greece’s exit from the Euro zone. On the other hand, news that the U.S. consumer sentiment rose in January to its highest level in 11 years on better job and wage prospects and consumer spending in the fourth quarter expanded at the fastest pace since 2006 failed to bring in the much need relief to the U.S. markets. Adding to the woes, the U.S. economy expanded at a slower-than-expected pace of 2.6% during the final quarter of 2014. The pace signaled a slowdown in growth after an expansion of 5% in the third quarter and the 4.6% pace in the second. Given the huge market volatility, ultra-safe bond funds emerged as one of the biggest winners in January as investors rushed in for safety. Not surprisingly, some of the commodity and oil & gas ETFs emerged as losers shedding in the double digits. Best ETFs Volatility ETFs Volatility ETFs were the major gainers amid the ongoing turbulence, as these tend to outperform when markets are falling or fear levels are high for the future. The iPath S&P 500 VIX Short-Term Futures ETN (NYSEARCA: VXX ) has been leading the space with a 17% return in January, closely followed by 16.89% for the C-Tracks Citi Volatility Index ETN (NYSEARCA: CVOL ). VXX is the most popular volatility ETN on the market with an asset base of $937.7 million and average trading volume of 43.1 million shares. The fund tracks the S&P 500 VIX Short-Term Futures Index to provide exposure to a daily rolling long position in the first and second months of VIX futures contracts. The expense ratio came in at 0.89%. Bond ETFs Given the uncertainty in the global market, investors are flocking to safe haven long-term government bonds to protect their portfolio from losses. The PIMCO 25+ Year Zero Coupon U.S. Treasury Index ETF (NYSEARCA: ZROZ ), the Vanguard Extended Duration Treasury ETF (NYSEARCA: EDV ) and the iShares 20+ Year Treasury Bond ETF (NYSEARCA: TLT ) emerged as some of the biggest winners in this space gaining in excess of 9%. ZROZ tracks the BofA Merrill Lynch Long US Treasury Principal STRIPS index and holds 21 securities in its basket. The effective maturity and effective duration of the fund stand at 27.38 years. The fund manages an asset base of $164.2 million and charges 15 bps in annual fees. ZROV has a 30-day SEC yield of 2.30% and is up 16% quarter-to-date. iShares Residential Real Estate Capped ETF (NYSEARCA: REZ ) In the current ultra-low environment, investors in search of juicy yields are continuing to pile up real estate funds which offer attractive payouts. The fund follows the FTSE NAREIT All Residential Capped Index and provides exposure to 37 U.S. residential real estate stocks and real estate investment trusts (REITs). REZ manages an asset base of $347.2 million with a 30-day SEC yield of 3.18% and has returned 8% in the past one month. ETF Losers SPDR S&P Metals & Mining ETF (NYSEARCA: XME ) XME was the biggest loser last month dragged down by weakness within the broad commodity space. The fund lost 12.1% in January and is down 31% in the past one year. XME is the largest and most popular fund in the metals and mining space with an asset base of $370.6 million and is highly liquid with an average trading volume of 2 million shares. The fund tracks the S&P Metals & Mining Select Industry Index to provide exposure to a basket of 35 stocks. The ETF charges 35 basis points a year. SPDR S&P Oil & Gas Equip & Service (NYSEARCA: XES ) The persistent decline in oil prices over the past six months has taken a toll on the overall energy sector as well as on the growth prospects of a number of oil producers. XES tracks the S&P Oil & Gas Equipment & Services Select Industry Index providing exposure to a basket of 52 stocks. Sector-wise, Oil & Gas Equipment & Services occupies 72.3% of fund assets followed by 27.7% to Oil & Gas Drilling. The fund manages an asset base of $169.5 million and has lost 11.5% last month. The fund currently has a Zacks ETF Rank #5 or Sell rating. First Trust ISE-Revere Natural Gas Index Fund (NYSEARCA: FCG ) The fund offers exposure to the U.S. stocks that derive a substantial portion of their revenues from the exploration and production of natural gas. It follows the ISE-Revere Natural Gas Index and holds 28 stocks in its basket, which are well spread out across each component with none holding more than 7% of assets. The fund has gathered an AUM of $240 million so far and sees good average daily volume of over 1.3 million shares. The fund has shed 10.5% in January and currently has a Zacks ETF Rank #5 or Sell rating.
ETFs For The Unquestioned ‘Wall Of Worry’

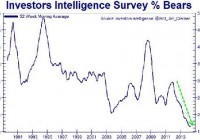
Wall Street stocks often climb in the face of negativity, pessimism and rational fears. With the Fed ending its electronic money printing in the U.S. while hinting at raising overnight lending rates, a continuation of the stock uptrend requires fuel from elsewhere. For now, the bond “wall of worry” and the “stock wall of worry” are not as important as the definitive uptrends for the assets. The crises of yesteryear almost seem quaint. Did investors really need to fret the possibility of the world’s 44th economy (Greece) exiting the euro-zone back in 2011? The stock market ultimately prevailed. Why did the fiscal cliff, sequestration and government shutdown concerns cause so much anxiety in 2012? U.S. stocks eventually powered ahead by roughly 14% that year. Discussion in 2013 of the Federal Reserve tapering its bond purchases in 2014? Please. Equities not only handled the notion of Fed stimulus ending, they knocked doubters on their backsides with two additional years of double-digit percentage gains. Indeed, Wall Street stocks often climb in the face of negativity, pessimism and rational fears. That is what bull markets are made of. On the other hand, when the investing community no longer worries – when the overwhelming majority of participants have no expectation of loss – dreams of risk-free wealth often turn to nightmares. Consider the chart below. The Investors Intelligence Survey’s percentage of self-described bears – those who believe the market will drop – has declined steadily over the last three years. It sits at the lowest level ever. And why not? U.S. stocks have rocketed ahead for three consecutive calendar cycles without so much as a 10% pullback. If every 4%-8% downward movement becomes a “buy-the-dip” opportunity – if people cannot recall the odious feelings associated with a correction of 10%-19% – they’re more likely to chalk up a bearish decline of 30%-plus as an aberration. Trillions in electronic currency creation, zero percent rate policy, corporate stock buybacks, margin debt, carry trade activity, a quest for yield as well as signs of domestic economic improvement have contributed to the amazing six-year performance for U.S. stocks. Of course, none of these things occurred independently. With the Fed ending its electronic money printing in the U.S. while hinting at raising overnight lending rates, a continuation of the stock uptrend requires fuel from elsewhere. Perhaps literally. Unfortunately, and yes, I do mean unfortunately, collapsing oil prices are not a windfall for the U.S. economy. Since 2009, employment in the oil industry has soared by as much as 50%. I have seen reports that energy jobs accounted for 40% of the national job growth since 2000. And these are high-paying careers that we are talking about, as opposed to the low-paying nature of retail, health service professionals and part-time work. The rapid descent in oil prices is a signal of a weakening global economy. Either we see the rest of the globe lose its fight against deflation, eventually dragging the U.S. down with it, or oil prices revert back to a spot price near $75 per barrel and stabilize the world order. I believe the latter is more probable. In fact, if oil fails to find a base that the world and the U.S. energy industry can live with, I believe the Fed will push off its rate normalization plans into the fall or wintertime. (More stimulus, more easy money… that will power stocks in 2015, right?) Indeed, I am long Exxon Mobil (NYSE: XOM ) as a dividend aristocrat that will benefit from greater oil price stability. And while client portfolios stopped out of a profitable position in UBS MLP Alerian Infrastructure (NYSEARCA: MLPI ) back in October, I may revisit the theme of energy infrastructure in the near future. If any sector could benefit from an unquestioned ascent on a “wall of worry,” it could be energy. Or, in contrast, energy could supplant the tech sector circa 2000-2002 and the financial sector circa 2007-2009. A great deal would depend on how Fed policy acts in the face of domestic and global economic deceleration. Will it be the dovish Fed that has maintained zero percent interest rates throughout the six-year bull market? Or will it be a more determined Fed that wants to give itself more breathing room by raising short-term rates, so that it does not need to sign on for QE4? Regardless, investors that have been suckered in by endless promises of rising interest rates need to recognize the unanimous refrain is almost always incorrect. Last year’s Bloomberg poll of the top 55 economists found that all 55 expect the 10-year yield to rise from 3.0%. The average forecast? 3.4%. Only a few folks like myself pointed to the relative value of U.S. treasuries compared with lesser quality sovereign debt abroad as well as the global economic slowdown. As we all know now, the 10-year fell to 2.2% from 3.0%. The economists are at it again. Nearly all of them say the 10-year yield will go higher, with an average forecast of 3.0% by 2015 year-end. I think the 10-year yield will probably be closer to 2%, especially with comparable German bunds below 1% and Japanese government 10-year bonds at 0.31%. Just like last year, I am quite content to keep utilizing longer-duration treasuries in funds like Vanguard Long Term Government Bond (NASDAQ: VGLT ) as well as iShares 10-20 Year Treasury (NYSEARCA: TLH ), as the yield curve continues to compress. Most of my clients have exposure to Vanguard Extend Duration (NYSEARCA: EDV ), though I would look for a bit of a shakedown before considering the longest end of the curve. Bottom line? Check your bond bearishness and stock bullishness at the door. Let the trendlines do the talking for both assets. For now, the bond “wall of worry” and the “stock wall of worry” are not as important as the definitive uptrends for the assets. One should let the uptrends in a stock stalwart like iShares USA Minimum Volatility (NYSEARCA: USMV ) as well as a bond winner like Vanguard Long Term Government ( VGLT ) speak for themselves. Disclosure: Gary Gordon, MS, CFP is the president of Pacific Park Financial, Inc., a Registered Investment Adviser with the SEC. Gary Gordon, Pacific Park Financial, Inc, and/or its clients may hold positions in the ETFs, mutual funds, and/or any investment asset mentioned above. The commentary does not constitute individualized investment advice. The opinions offered herein are not personalized recommendations to buy, sell or hold securities. At times, issuers of exchange-traded products compensate Pacific Park Financial, Inc. or its subsidiaries for advertising at the ETF Expert web site. ETF Expert content is created independently of any advertising relationships.

Gary Gordon Positions For 2015: Tactical Asset Allocations For ETF Investors

This is the third piece in Seeking Alpha’s Positioning for 2015 series. This year we have once again asked experts on a range of different asset classes and investing strategies to offer their vision for the coming year and beyond. As always, the focus is on an overall approach to portfolio construction. Gary A. Gordon, MS, CFP® is the president of Pacific Park Financial, Inc. , a Registered Investment Adviser with the SEC. He has more than 24 years of experience as a personal coach in “money matters,” including risk assessment, small business development and portfolio management. Gary is often asked to consult as an educator. He has taught financial concepts in Mexico, Singapore, Hong Kong, Taiwan and the United States. As a Certified Financial Planner™ (CFP®), Gary has distinguished himself as a reputable and trusted investor advocate. He writes commentary for ETF Expert, Seeking Alpha and TheStreet. Gary’s participation on local and national radio has spanned more than a decade, and he currently hosts the ETF Expert Show. Seeking Alpha’s Carolyn Pairitz recently spoke with Gary to find out how he goes about selecting specific ETFs and plans to use them to position clients in 2015. Carolyn Pairitz (CP): How would your clients describe your investing style/philosophy? Gary Gordon (GG): My clients would recite my mantra… There are four possible investing outcomes (i.e., big gain, small gain, small loss, big loss) and three of them are good. Successful investing is about controlling the investing outcome so that you ensure a big gain, small gain or small loss, and take action to avoid the big loss. The humongous loss is the only thing that can destroy a lifetime of wealth-building. By way of example, I may own rental property in California where I live, perhaps for its capital appreciation potential as well as its annual cash flow. And along the way, I may experience price gains and dips, good renters and bad. But the one thing that my financial well-being would not be able to tolerate is an earthquake that decimates the property. It follows that, I may not enjoy paying the earthquake insurance premium each year, but I understand the criticality of doing so. The exact same insurance principles go for investing in market-based securities. Stop-limit loss orders, technical trendlines, put options, non-correlated assets, hedges – no technique or asset type will eliminate downside risk completely nor appear particularly worthwhile in extremely bullish uptrends. Yet the tactical asset allocation decision-making to insure against the only thing that can kill a portfolio – the big loss – keeps my clients on track to achieve their financial freedom goals. CP: Which global issue is most likely to adversely affect U.S. markets in 2015? GG: Ironically enough, I have the same answer for 2015 that I provided in 2014’s interview: Deflation. Europe and Japan are both still struggling to beat deflationary pressures back; their 2014 efforts to stimulate their respective economies with asset purchases and negligible/non-existent or even negative overnight lending rates have pummeled their currencies more than anything else. Indeed, the U.S. stock bull got knocked for a loop in October because of deflationary recession scares around the globe. So what did the U.S. Fed do? One of its committee members publically questioned whether or not the institution should even end QE3. Only then did U.S. large cap stocks rapidly recover from what might have been far worse than an intra-day 9.8% correction. For better or worse, our market continues to rely on central bank manipulation. The Fed will be exceedingly “patient” in 2015, and may even decide by late 2015 to talk about ways to be accommodative yet again. They may have no choice. Consider the fact that, while Russia’s direct impact on the U.S. economy is small, the country matters a whole lot to Europe’s well-being. And Europe is reeling even without Russian woes. In essence, if world markets determine that the European Central Bank (ECB) is not aggressive enough with its stimulus, a region-wide recession would certainly drag on U.S. equities. CP: Have any ETFs that have launched this year caught your eye? GG: I like the work that Meb Faber does in the value space. The Cambria Global Value ETF (NYSEARCA: GVAL ) is remarkably intriguing in theory, though I do not buy assets based solely on low P/Es or low P/S ratios. Russia started the year as the least expensive global equity market, and it only got cheaper. And then there’s the fact that I lived in Asia on and off for roughly 4 ½ years, so the Deutsche X-trackers Harvest CSI 300 China A-Shares ETF (NYSEARCA: ASHR ), which technically launched in 2013, has also been intriguing. Gaining access to stocks listed in China, the world’s second largest economy, is something that everyone should be thinking about. CP: What do you hope to see from the ETF industry in 2015? Any product filings you are particularly excited to see launch? GG: I anticipate interest in an exchange-traded vehicle that tracks the index that I created with FTSE-Russell, the FTSE Custom Multi-Asset Stock Hedge Index. Obviously, I hope to see it launch because it would be beneficial to me personally, but I am equally hopeful for those who want an alternative to shorting, leverage, inverse funds or T-bills. Let’s be real for a moment. The U.S. economy cannot continue to accelerate if the world continues to decelerate. Investors cannot ignore the mountain of stock overvaluation evidence indefinitely, no matter how many rabbits the world’s central banks pick out of their collective hats. And periods of amplified exuberance always find themselves, later or sooner, at a place of heart-pounding panic. An exchange-traded vehicle for the FTSE Custom Multi-Asset Stock Hedge Index should reduce the anxiety associated with stock downturns. CP: Could you please describe this stock hedge index in more detail? What was your process for developing it? GG: My colleague and I started from a place where we investigated the currencies, commodities, foreign debt and U.S. debt (basically, all non-equity investments), that have a history of exceptionally low correlations to stocks. And then, in combination, demonstrate as close to the holy grail of zero correlation as possible. We looked at performance as well as fund flow movement in times of moderate to severe stock stress. Historically speaking, currencies like the dollar, the franc and the yen – all for very different reasons – have served as admirable hedges. Gold, more or less, had been the commodity of choice. Meanwhile, Japanese government bonds, German bunds and a fairly wide range of longer-maturity U.S. bonds worked remarkably well too. To be clear, owning a fund that tracks this index, or choosing multiple assets to emulate it, is not meant for benchmarking a “bear fund.” Bear funds look to profit from short positions or the stock market falling. The FTSE Custom Multi-Asset Stock Hedge Index is designed to hedge against stock ownership and the risks associated with it. Similarly, owning a single asset like T-bill cash or a U.S. Treasury bond ETF alone does not offer the benefit of diversification across multiple asset avenues. Only now, is multi-asset stock hedging even available in an index. And while it is most likely to perform well when stocks are not… this isn’t a prerequisite. For example, the FTSE Custom Multi-Asset Stock Hedge Index (through 12/15/14) was up 6.5%, even in a year when large-cap U.S. stocks have performed well. CP: Going into 2015, which asset classes are you overweight? Which are you underweight? GG: Remember, we use tactical asset allocation and we are not static buy-n-holders. We are currently overweight U.S. mega-caps through funds like the iShares 100 ETF (NYSEARCA: OEF ) and the Vanguard Mega Cap Growth ETF (NYSEARCA: MGK ), as well as U.S. minimum volatility through iShares USA Minimum Volatility ETF (NYSEARCA: USMV ). And yes, I believe “low vol” is an asset class, though “low vol” by sector, not by the market at large. Otherwise, you own a whole of utilities and non-cyclicals, rather than a fairly well-distributed mix across the economic segments. I have also been picking through the energy rubbish bin. On the debt side of the equation, much like 2014, we currently own bond assets that have relative value when compared to foreign debt. There is plenty of value in owning the Vanguard Long Term Bond ETF (NYSEARCA: BLV ) and/or the Vanguard Extended Duration Treasury ETF (NYSEARCA: EDV ). People may think that is nuts, but those are the same folks who completely missed the 2014 boat. So let me toot my own horn on this one, I was one of the very few who said rates would go down, the yield curve would flatten, and that these funds would be big time winners. We also own muni debt via the SPDR Barclays Municipal Bond ETF (NYSEARCA: TFI ) as well as closed-end funds like the Blackrock MuniAssets Fund (NYSE: MUA ). I have been underweight small caps, foreign, emerging since July of 2014. And while I own held-to-maturity high yield bond investments in the Guggenheim Series, in general, widening credit spreads have made me steer clear of high yield bonds. CP: What advice would you give to a ‘do-it-yourself’ investor in the present investing environment? GG: Be mindful of where things stand. We are talking about the fourth longest bull market since 1897. The other three? They did not make it past eight years. Either we will break records with this bull market, or more likely, we will see a bear market in 2015 or 2016. The problem is not participating in stocks during periods of amplified exuberance and overlooked overvaluation – that’s how money was made in the ’90s and in the mid-2000s. So you should definitely participate. The problem is failing to take action to minimize downside risks – that’s how investors got creamed in 2000-2002 and 2008-2009. Whether someone does it for you or whether you do it yourself, you must have a plan to avoid the bulk of an upcoming disaster. Disclosure: Gary Gordon, MS, CFP is the president of Pacific Park Financial, Inc., a Registered Investment Adviser with the SEC. Gary Gordon, Pacific Park Financial, Inc, and/or its clients may hold positions in the ETFs, mutual funds, and/or any investment asset mentioned above. The commentary does not constitute individualized investment advice. The opinions offered herein are not personalized recommendations to buy, sell or hold securities. At times, issuers of exchange-traded products compensate Pacific Park Financial, Inc. or its subsidiaries for advertising at the ETF Expert web site. ETF Expert content is created independently of any advertising relationships.