Tag Archives: nysearcablv

Duplicating The All-Weather Fund Using Low-Cost ETFs

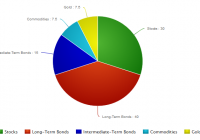
Summary Tony Robbins’ newest book reveals the asset allocation of Ray Dalio’s All-Weather Fund. The allocation is designed to balance the percentage of risk rather than the percentage of money to each asset. This strategy can be replicated using low-cost ETFs, but the biggest challenge is in sticking with the allocation as the years go by and each asset performs differently. Everyone in the business knows Ray Dalio is the manager of the world’s largest hedge fund, but his portfolio strategy has not always been very accessible by the public. Dalio has not added any clients in ten years, and even then, the only way to get access to the fund was with a net worth of at least four billion dollars and a minimum investment of 100 million dollars. Luckily, when Tony Robbins sat down with Dalio to interview him for his latest book , Ray shared the specifics of how he allocates the All-Weather fund. So this article will look at how to replicate that portfolio using a series of low-cost ETFs. Keep in mind that the fund does use leverage to increase the returns, and this allocation does not include any of the hedging activities. The large percentage allocated to bonds is a surprise to most, but the reasoning behind it is based on balancing the percentage of risk rather than the percentage of money put into each asset. Stocks are three times more volatile than bonds, so putting a higher percentage into bonds balances the risk in a way that putting 50/50 stocks and bonds wouldn’t. So the 15% in gold and commodities works the same way, as these are more volatile than both stocks and bonds. This approach is not all that different from Harry Browne’s permanent portfolio concept, which is a little more simple with 25% stocks, 25% bonds, 25% cash, and 25% gold. Swiss investor Marc Faber also recommends a similar allocation , 25% stocks, 25% bonds/fixed income, 25% real estate, and 25% gold. Dr. Faber’s portfolio is more suited towards very wealthy individuals, and it is closer to the “one third, one third, one third” concept that Jim Rickards talks about in regards to how wealthy families keep their wealth intact over many generations. The allocation is one third in land, one third in gold, and one third in fine art. This particular strategy takes a VERY long-term point of view and looks to protect and preserve wealth against any and all crises from depressions, wars, to hyperinflation. Dalio’s All-Weather fund is not centered around hedging against inflation/hyperinflation as much as the portfolios mentioned above, but the 15% in gold and commodities shows that he does have some concerns about inflation even though he might not think severe inflation is inevitable and imminent. In fact, it was the historic event in 1971 of President Nixon taking the US off the gold standard for good that greatly shaped Ray’s “all weather” strategy and realization that no one can really predict which investments will do best in the future. So here are the best choices of ETFs for replicating the All-Weather portfolio: 40% Long-Term Bonds Vanguard Long-Term Bond ETF (NYSEARCA: BLV ) With assets totaling 1.2 billion dollars, this fund invests in both government and investment-grade corporate long-term bonds. The mix of corporate bonds helps to give the yield a boost that one would not get by going only with government bonds. Of course, when you go with any Vanguard ETF, you are usually getting the lowest expense ratio in the industry, and with this particular ETF, the ER is only .10%. The yield is 4.05%. 15% Intermediate-Term Bonds Vanguard Intermediate-Term Bond ETF (NYSEARCA: BIV ) This popular fund is even bigger with total assets of 5.95 billion dollars. There are not too many differences between this fund and BLV, except that this fund of course holds only shorter-term bonds. The yield is 2.73%, and the expense ratio is also a very low .10%. For this 15% portion, you could also split it into two, with BIV on one side and a TIPS ETF on the other. 30% Stocks Vanguard S&P 500 ETF (NYSEARCA: VOO ) Only 30% in stocks seems very low compared to conventional wisdom. Again though, Dalio’s strategy puts the assets with the most volatility as a lower percentage of the portfolio. VOO is a large fund with 34.41 billion in assets . The expense ratio is .05%, which is very important for the long-term investor and the highlight of this ETF. The yield for VOO is 2.01%. In some of my recent articles, I have been highlighting ETFs that can provide income that would be cushioned from a major crash in the US, which I anticipate, although I won’t put a time on it. So, in that vein, I would add to this by splitting the equities portion of this strategy into two parts; one, domestic equities, and the other, international equities. For the international exposure, I think the Vanguard FTSE All-World Ex-US ETF (NYSEARCA: VEU ) is the best choice within this strategy. This ETF has 14.82 billion in assets , an expense ratio of .14%, and the yield is 2.81%. 7.5% Gold and 7.5% Commodities iShares Gold Trust ETF (NYSEARCA: IAU ) and PowerShares DB Commodity Index Tracking ETF (NYSEARCA: DBC ) This allocation to gold and commodities again goes against conventional wisdom. Considering the most recent downturn in gold, it would be even more difficult for most people to consider gold and commodities in their portfolio. It is easily the most hated commodity in world today, or at least it is the most hated in the financial mainstream media. Gold and the whole natural resource sector have been in a deflation since 2011, but that does not change the fact that since the late 90s, gold has outperformed the Dow, the S&P 500, as well as Berkshire Hathaway (NYSE: BRK.A ) (NYSE: BRK.B ). (click to enlarge) So, for this portion of the portfolio, IAU works best for the gold portion, because it has the lowest expense ratio of any gold ETF at .25%, as well as plenty of liquidity. For the commodities, DBC is a good choice. It tracks the DBIQ Optimum Yield Diversified Commodity Index Excess Return™ which has exposure to 14 of the most heavily traded commodities. While the expense ratio is higher than I would like at .85%, the fund offers exposure to the futures market without going through the actual trading process yourself. SA contributor Dan Bortolotti points out that this allocation did not provide mind-blowing returns over the past three decades (9.7% annualized returns) and that most people could not stomach any one asset going through turmoil while another asset is rising. The problem lies in the emotions of individual investors though, not in the actual portfolio. However you slice it up, it is going to be very difficult for most people to sit by while any part of their portfolio is not performing very well. The natural instinct is to sell the portion that is underperforming and be overweight the portion that is doing good. How many of the people who were 90% stocks and 10% bonds stuck with that strategy in 2008 when the crisis was going on? What about putting all your eggs in one basket, would that not cause tremendous pain when that one asset inevitably goes through a bear market? All that most people will need is basic asset allocation of their assets and the ability to stick with the allocation over a period of decades. Even for the person who is not a financial expert, the better option is to keep a core portfolio of low-cost and commission-free ETFs instead of letting a mutual fund do the same thing but with extra fees attached. Disclosure: I/we have no positions in any stocks mentioned, and no plans to initiate any positions within the next 72 hours. (More…) I wrote this article myself, and it expresses my own opinions. I am not receiving compensation for it (other than from Seeking Alpha). I have no business relationship with any company whose stock is mentioned in this article.

3 ETF Investing Themes For A Wobbly U.S. Bull

The Fed explains that it is serious about raising interest rates in 2015. Janet Yellen’s Fed expressed confidence that in spite of the failure of QE3 and ZIRP to influence rising prices, those rising prices should gradually reach the target of 2% in a tightening cycle. There are perhaps three investment themes that make sense at this point in the late stage U.S. bull market. Presumably, the Great Recession ended in June of 2009. Three months earlier on March 9, the stock market anticipated the modest recovery that is still intact. In essence, stocks began to rally well in advance of the actual turnaround in the U.S. economy. Similarly, the 10/09/2002-10/09/2007 bull market ended roughly three months before the start of the mammoth economic collapse (12/2007). In a sense, stock barometers were (and are) leading indicators of things to come. For those who wish to believe that stocks will avoid a 20%-plus bearish setback on a combination of monetary policy gamesmanship and perceived economic strength, they might want to consider the history of recessions as well as the history of central bank stimulus. With some 50-odd contractions over the last 225 years, one should expect expansions to falter, on average, every four-and-a-half years. The current recovery? Five-and-a-half and counting. It is also worth noting that past recessions required the U.S. Federal Reserve to lower overnight lending rates by 3%-4% to combat recessionary forces. Even if the Fed manages to get the Fed Funds rate up to 0.5% in 2015 – even if policymakers succeed in pushing it up to a “whopping” 1% in 2016 – wouldn’t they have to return to 0% and more quantitative easing (QE) when the inevitable economic contraction returns? Central bank QE as well as zero percent interest rates (ZIRP) have lowered the costs to service higher household and government debts ; they have increased the rewards for risk-taking in real estate as well as as market-based securities. Yet these policies have not done a great deal to assure prosperity, as median household income is lower than it was in the heart of the Great Recession. Equally troubling, survey stand-out Gallup determined that business closings have exceeded the number of new businesses created each year since 2008. According to some analysts , the opening/closing business data may even be responsible for the Bureau of Labor Statistics ( BLS ) overstating job growth by as much as 600,000 jobs annually. Nevertheless, the Fed explains that it is serious about raising interest rates in 2015. Stock bulls used to relish this type of optimism, particularly with respect to jobs. (You might want to ask the workers at Schlumberger (NYSE: SLB ), IBM (NYSE: IBM ), Haliburton (NYSE: HAL ), American Express (NYSE: AXP ) and U.S. Steel (NYSE: X ) if they share the sentiment.) And then there is the reality that inflation has remained below its 2% target for 30-plus months. Janet Yellen’s Fed expressed confidence that in spite of the failure of QE3 and ZIRP to influence rising prices, those rising prices should gradually reach the target of 2% in a tightening cycle. Really? Do investors even recognize that the Fed projected far greater economic growth than has actually occurred in every single year since 2008? Knowing that, why would anyone have confidence in a Fed expectation of 2% inflation? There are perhaps three investment themes that make sense at this point in the late stage U.S. bull market. First, the entire globe is in the process of stimulating economic growth through conventional and/or unconventional measures. Why fight their central banks? As bond yields around the world continue moving lower, the activity only makes longer-term, dollar-denominated debt more attractive. If you want to buy the proverbial dips, you should probably be buying the bond dips on relative value . Consider the iShares 10-20 Year Treasury Bond ETF (NYSEARCA: TLH ), the Vanguard Long-Term Bond ETF (NYSEARCA: BLV ) and closed-end muni fund like the Nuveen Municipal Opportunity Fund (NYSE: NIO ). The second theme involves buying stimulus-driven stock ETFs. The WisdomTree India Earnings ETF (NYSEARCA: EPI ) has been a tremendous beneficiary of its own country’s unexpected rate cut activity, while the iShares Currency Hedged MSCI Germany ETF (NYSEARCA: HEWG ) should benefit from the markedly lower euro and the negligible German bund yields that push investors into German equities. Third, investors should continue to hold prominent U.S. equity ETFs for as long as they are still working for them. I still maintain an allegiance to the Health Care Select Sect SPDR ETF (NYSEARCA: XLV ), the iShares MSCI USA Minimum Volatility ETF (NYSEARCA: USMV ) as well as the Vanguard High Dividend Yield ETF (NYSEARCA: VYM ). If any of these positions break below a 200-day moving average, however, I would insure against further depreciation by selling the position or increasing exposure to the index that my colleague and I created, the FTSE Custom Mutli-Asset Stock Hedge Index . One can already see the benefits of multi-asset stock hedging over 1 months, 3 months, 6 months and 1 year, where the combination of certain currencies, commodities, foreign sovereign debt and U.S. bonds are achieving desirable results. Disclosure: Gary Gordon, MS, CFP is the president of Pacific Park Financial, Inc., a Registered Investment Adviser with the SEC. Gary Gordon, Pacific Park Financial, Inc, and/or its clients may hold positions in the ETFs, mutual funds, and/or any investment asset mentioned above. The commentary does not constitute individualized investment advice. The opinions offered herein are not personalized recommendations to buy, sell or hold securities. At times, issuers of exchange-traded products compensate Pacific Park Financial, Inc. or its subsidiaries for advertising at the ETF Expert web site. ETF Expert content is created independently of any advertising relationships.

State Of Disunion: Safer Haven Investments Diverge From Stocks

The appetite for risk has been changing before our eyes. Large-cap U.S. stocks in the S&P 500 still rocketed mightily. Safer haven assets were every bit as desirable as the Dow and the S&P 500 in 2014. Is that uncommon for a late-stage bull market? Not particularly. On the other hand, the landscape may be changing. The S&P 500 soared 29.6% and 11.4% in 2013 and 2014 respectively, pushing the broad market benchmark to unimaginable heights. Net inflows into U.S. stock funds, including ETFs, also set records. Unfortunately, that is not always a positive sign for the asset class. The increased participation by the world’s investors in U.S. stocks may not be inordinately alarming. What might be far more ominous? The remarkable performance of safer haven assets over “stuck-in-place” stock assets since the Federal Reserve ended its third round of quantitative easing (QE3) on October 31. Specifically, the 30-year treasury yield has plummeted from roughly 3.0% to 2.4%, sending a proxy like the PIMCO 25+ Year Zero Coupon U.S. Treasury Index ETF (NYSEARCA: ZROZ ) up more than 20%. Similarly, the iShares 20+ Year Treasury Bond ETF (NYSEARCA: TLT ) has pocketed nearly 14%, while the SPDR Gold Trust ETF (NYSEARCA: GLD ) has rallied about 10%. The appetite for risk has been changing before our eyes. Remember the success of riskier equities in 2013, as investors ran from treasury bonds and gold? Indeed, 2013 was only one of two negative years for total bond returns across two decades. Equally staggering, gold appeared to many as if it might collapse altogether. The nature of risk shifted in 2014. Large-cap U.S. stocks in the S&P 500 still rocketed mightily. Yet the clear preference of stocks over safer holdings evaporated; treasuries rallied throughout the year, in spite of the near-unanimous sentiment that interest rates would fall. (Note: I am not opposed to tooting my own horn on this one – I recommended pairing large-cap stock ETFs with long duration treasury ETFs like the Vanguard Extended Duration Treasury ETF (NYSEARCA: EDV ) and ZROZ 13 months earlier.) Safer haven assets were every bit as desirable as the Dow and the S&P 500 in 2014. Some of them like TLT and ZROZ were more desirable. At least for a calendar round-trip, the ownership of historically divergent asset classes produced harmony and indivisibility. Is that uncommon for a late-stage bull market? Not particularly. On the other hand, the landscape may be changing. The perceived need for safety has risen appreciably since the Federal Reserve ended its electronic money printing in October. For example, in 2015, each of the 10 components of the FTSE Custom Multi-Asset Stock Hedge Index has gained ground, whereas the S&P 500 has drifted lower. Those component assets include long-maturity treasuries, zero-coupon bonds, munis, inflation-protected securities, German bunds, Japanese government bonds, gold, the Swiss franc, the yen and the dollar. Granted, the European Central Bank (ECB) intention to create $50 billion euros monthly for a year could reward risk-taking in the same manner that the Federal Reserve’s $85 billion per month had. On the flip side, the $600 billion euro figure that is floating on newswires may come off as underwhelming, as the Fed’s QE3 had been open-ended upon its announcement. Moreover, the “stimulus” amount ran beyond the trillion-and-a-half level. Keep in mind, you do not need to run from stock risk if you have a plan to minimize the severe capital depreciation associated with bear markets. My approach in latter stage bull markets involves pairing lower volatility stock ETFs like the iShares MSCI USA Minimum Volatility ETF (NYSEARCA: USMV ) and the iShares S&P 100 ETF (NYSEARCA: OEF ) with safer haven ETFs like the Vanguard Long-Term Bond ETF (NYSEARCA: BLV ) and EDV. If popular stock benchmarks breach 200-day trendlines, I reduce equity exposure and/or employ multi-asset stock hedging by investing in those assets with a history of performing well in moderate-to-severe stock downturns. Click here for Gary’s latest podcast. Disclosure: Gary Gordon, MS, CFP is the president of Pacific Park Financial, Inc., a Registered Investment Adviser with the SEC. Gary Gordon, Pacific Park Financial, Inc, and/or its clients may hold positions in the ETFs, mutual funds, and/or any investment asset mentioned above. The commentary does not constitute individualized investment advice. The opinions offered herein are not personalized recommendations to buy, sell or hold securities. At times, issuers of exchange-traded products compensate Pacific Park Financial, Inc. or its subsidiaries for advertising at the ETF Expert web site. ETF Expert content is created independently of any advertising relationships.