Tag Archives: nysearcabiv

Dividend Oriented Retirement Portfolio Using Only 9 Commission Free ETFs

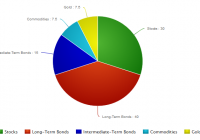
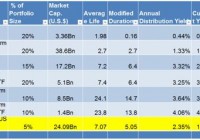
Asset allocation is set to generate approximately 3.0% yield. Dual momentum option is designed to enhance return while reducing risk. Three portfolio management styles are: Passive, Dual Momentum, and Tranche. A Tranche Model will reduce “luck” of rebalancing. Dividend yield closely matches that provided by a portfolio of Dividend Aristocrats. Retirement goals drive investors to save and invest. The following three models use eight ETFs for investing and one ETF, the iShares 1-3 Year Treasury Bond ETF ( SHY), as a cutoff or “circuit breaker” security. When set up using the following asset allocations, the portfolio will generate approximately 3.0% annually or not far off a portfolio built around Dividend Aristocrats. The nine ETFs are as follows. Vanguard Total Stock Market ETF ( VTI) Vanguard FTSE Developed Markets ETF ( VEA) Vanguard FTSE Emerging Markets ETF ( VWO) Vanguard REIT Index ETF ( VNQ) SPDR Dow Jones International Real Estate ETF ( RWX) PowerShares Emerging Markets Sovereign Debt Portfolio ETF ( PCY) iShares 20+ Year Treasury Bond ETF ( TLT) Vanguard Intermediate-Term Bond ETF ( BIV) iShares 1-3 Year Treasury Bond ETF (( SHY)) Passive Portfolio Model: The next major decision focuses on what percentage to invest in each ETF if one is constructing a portfolio to be passively managed. The percentage allocations follow the ” Swensen Six ” recommendations with a few modifications. RWX and PCY are new additions and BIV replaces TIP. SHY is the ninth ETF and is used strictly as a cutoff ETF in the momentum and tranche models – to be described below. VTI = 30% with a 1.96% yield VEA = 10% with a 3.07% yield VWO = 10% with a 3.1% yield VNQ = 15% with a 4.11% yield RWX = 5% with a 3.2% yield PCY = 10% with a 5.07% yield TLT = 10% with a 2.66% yield BIV = 10% with a 2.7% yield Using the above asset allocations, all one needs to do is keep the various asset classes in balance or close to the suggested targets. All ETFs pay a nice dividend, an advantage for retirees, while providing an equity emphasis for future return. The portfolio also meets the diversification requirement as there are hundreds of stocks and bonds spread out all over the globe. Dual Momentum Model: The dual momentum model is slightly more complicated compared to the passive model in that it requires a bit more time to manage. The basic concepts behind this model can be found in Antonacci’s Dual Momentum book or a condensed version in this Seeking Alpha article . The major advantage of this investing model is keep one out of deep bear markets as we experienced in the early part of this century and again in 2008 and early 2009. Using the same eight commission free ETFs, three metrics are used to rank the securities and compare performance with SHY. 1. Return of Capital (ROC1 and ROC2) are assigned weights of 50% and 30%. 2. Look-back periods are 91 and 182 calendar days. 3. A 20% weight is assigned to volatility where a mean-variance calculation is used and low volatility is rewarded. When a portfolio is reviewed, the securities are ranked as shown below. The recommendation is to only invest in the top two ranked ETFs, and then only if they are outperforming SHY. Based on current data (10/2/2015) only BIV and TLT meet this standard so 50% of the portfolio is invested in BIV and 50% in TLT. If there is a tie, then the investments are split evenly three ways. (click to enlarge) Tranche Model: The Tranche Model may be new to many investors and therefore requires a little explanation. The logic behind this model is to mitigate the “luck-of-review-day” problem. I review portfolios every 33 days so the reviews come at different times of the month. This also avoids wash sale issues and short-term trading fees that are accessed by brokers offering commission free ETFs. When a specific review days is selected, the dual momentum recommendations can vary from day to day. We might be lucky and find recommended buys on a day when the market down, or we could be unlucky and end up with a pair of ETFs that were not ranked so high on trading days on either side of the review day. What the Tranche Model (TM) does is permit the user to select multiple portfolios using different days of separation. The TM answers the question, what was the dual momentum recommendation two days ago, or four days ago? While the Tranche Model reduces risk, it also tends to reduce return. In the following screen-shot the number of Offset Portfolios is set to eight (8). The software permits as many as 12 portfolio options. The period (trading days) between offsets is set to 2. Otherwise, the settings are similar to the above dual momentum screen-shot. Recommendations from the Tranche Model, if rounding to the nearest 50 shares, are as follows. For a $100,000 portfolio, buy 200 shares of SHY or leave in cash. Purchase 400 shares of PCY, 250 shares of TLT, and 450 shares of BIV. Once the portfolio is positioned based on these recommendations, do nothing until the next portfolio review. (click to enlarge) The passive portfolio is the easiest to manage and there are tax advantages as shares are held for long periods of time. The dual momentum and tranche models require more attention, but will prevent major losses when major bear markets strike.

Duplicating The All-Weather Fund Using Low-Cost ETFs

Summary Tony Robbins’ newest book reveals the asset allocation of Ray Dalio’s All-Weather Fund. The allocation is designed to balance the percentage of risk rather than the percentage of money to each asset. This strategy can be replicated using low-cost ETFs, but the biggest challenge is in sticking with the allocation as the years go by and each asset performs differently. Everyone in the business knows Ray Dalio is the manager of the world’s largest hedge fund, but his portfolio strategy has not always been very accessible by the public. Dalio has not added any clients in ten years, and even then, the only way to get access to the fund was with a net worth of at least four billion dollars and a minimum investment of 100 million dollars. Luckily, when Tony Robbins sat down with Dalio to interview him for his latest book , Ray shared the specifics of how he allocates the All-Weather fund. So this article will look at how to replicate that portfolio using a series of low-cost ETFs. Keep in mind that the fund does use leverage to increase the returns, and this allocation does not include any of the hedging activities. The large percentage allocated to bonds is a surprise to most, but the reasoning behind it is based on balancing the percentage of risk rather than the percentage of money put into each asset. Stocks are three times more volatile than bonds, so putting a higher percentage into bonds balances the risk in a way that putting 50/50 stocks and bonds wouldn’t. So the 15% in gold and commodities works the same way, as these are more volatile than both stocks and bonds. This approach is not all that different from Harry Browne’s permanent portfolio concept, which is a little more simple with 25% stocks, 25% bonds, 25% cash, and 25% gold. Swiss investor Marc Faber also recommends a similar allocation , 25% stocks, 25% bonds/fixed income, 25% real estate, and 25% gold. Dr. Faber’s portfolio is more suited towards very wealthy individuals, and it is closer to the “one third, one third, one third” concept that Jim Rickards talks about in regards to how wealthy families keep their wealth intact over many generations. The allocation is one third in land, one third in gold, and one third in fine art. This particular strategy takes a VERY long-term point of view and looks to protect and preserve wealth against any and all crises from depressions, wars, to hyperinflation. Dalio’s All-Weather fund is not centered around hedging against inflation/hyperinflation as much as the portfolios mentioned above, but the 15% in gold and commodities shows that he does have some concerns about inflation even though he might not think severe inflation is inevitable and imminent. In fact, it was the historic event in 1971 of President Nixon taking the US off the gold standard for good that greatly shaped Ray’s “all weather” strategy and realization that no one can really predict which investments will do best in the future. So here are the best choices of ETFs for replicating the All-Weather portfolio: 40% Long-Term Bonds Vanguard Long-Term Bond ETF (NYSEARCA: BLV ) With assets totaling 1.2 billion dollars, this fund invests in both government and investment-grade corporate long-term bonds. The mix of corporate bonds helps to give the yield a boost that one would not get by going only with government bonds. Of course, when you go with any Vanguard ETF, you are usually getting the lowest expense ratio in the industry, and with this particular ETF, the ER is only .10%. The yield is 4.05%. 15% Intermediate-Term Bonds Vanguard Intermediate-Term Bond ETF (NYSEARCA: BIV ) This popular fund is even bigger with total assets of 5.95 billion dollars. There are not too many differences between this fund and BLV, except that this fund of course holds only shorter-term bonds. The yield is 2.73%, and the expense ratio is also a very low .10%. For this 15% portion, you could also split it into two, with BIV on one side and a TIPS ETF on the other. 30% Stocks Vanguard S&P 500 ETF (NYSEARCA: VOO ) Only 30% in stocks seems very low compared to conventional wisdom. Again though, Dalio’s strategy puts the assets with the most volatility as a lower percentage of the portfolio. VOO is a large fund with 34.41 billion in assets . The expense ratio is .05%, which is very important for the long-term investor and the highlight of this ETF. The yield for VOO is 2.01%. In some of my recent articles, I have been highlighting ETFs that can provide income that would be cushioned from a major crash in the US, which I anticipate, although I won’t put a time on it. So, in that vein, I would add to this by splitting the equities portion of this strategy into two parts; one, domestic equities, and the other, international equities. For the international exposure, I think the Vanguard FTSE All-World Ex-US ETF (NYSEARCA: VEU ) is the best choice within this strategy. This ETF has 14.82 billion in assets , an expense ratio of .14%, and the yield is 2.81%. 7.5% Gold and 7.5% Commodities iShares Gold Trust ETF (NYSEARCA: IAU ) and PowerShares DB Commodity Index Tracking ETF (NYSEARCA: DBC ) This allocation to gold and commodities again goes against conventional wisdom. Considering the most recent downturn in gold, it would be even more difficult for most people to consider gold and commodities in their portfolio. It is easily the most hated commodity in world today, or at least it is the most hated in the financial mainstream media. Gold and the whole natural resource sector have been in a deflation since 2011, but that does not change the fact that since the late 90s, gold has outperformed the Dow, the S&P 500, as well as Berkshire Hathaway (NYSE: BRK.A ) (NYSE: BRK.B ). (click to enlarge) So, for this portion of the portfolio, IAU works best for the gold portion, because it has the lowest expense ratio of any gold ETF at .25%, as well as plenty of liquidity. For the commodities, DBC is a good choice. It tracks the DBIQ Optimum Yield Diversified Commodity Index Excess Return™ which has exposure to 14 of the most heavily traded commodities. While the expense ratio is higher than I would like at .85%, the fund offers exposure to the futures market without going through the actual trading process yourself. SA contributor Dan Bortolotti points out that this allocation did not provide mind-blowing returns over the past three decades (9.7% annualized returns) and that most people could not stomach any one asset going through turmoil while another asset is rising. The problem lies in the emotions of individual investors though, not in the actual portfolio. However you slice it up, it is going to be very difficult for most people to sit by while any part of their portfolio is not performing very well. The natural instinct is to sell the portion that is underperforming and be overweight the portion that is doing good. How many of the people who were 90% stocks and 10% bonds stuck with that strategy in 2008 when the crisis was going on? What about putting all your eggs in one basket, would that not cause tremendous pain when that one asset inevitably goes through a bear market? All that most people will need is basic asset allocation of their assets and the ability to stick with the allocation over a period of decades. Even for the person who is not a financial expert, the better option is to keep a core portfolio of low-cost and commission-free ETFs instead of letting a mutual fund do the same thing but with extra fees attached. Disclosure: I/we have no positions in any stocks mentioned, and no plans to initiate any positions within the next 72 hours. (More…) I wrote this article myself, and it expresses my own opinions. I am not receiving compensation for it (other than from Seeking Alpha). I have no business relationship with any company whose stock is mentioned in this article.

Back To The Box Paradigm: A U.S. Fixed Income ETF Portfolio

Summary As markets make incomprehensible moves, stick to your rules, build a box. Do not attempt to chase market shadows, but devise and maintain strategies that fit your needs. One such strategy entails accepting duration risk for a higher distribution yield relative to a benchmark. Back To The Box Paradigm: A U.S. Fixed Income ETF Portfolio When the markets are moving in directions you cannot comprehend and cynicism erupts, stick to your rules. Make a box and stay inside of it. Do not attempt to chase shadows, but devise and maintain strategies that work. One such strategy, the box paradigm, is designed to accept duration risk for a higher distribution yield than its benchmark, the iShares Core U.S. Aggregate Bond ETF (NYSEARCA: AGG ). An ETF portfolio was selected to meet these objectives and is seen below in Table 1: (NYSEARCA: FLOT ) – iShares Floating Rate Bond ETF (NYSEARCA: BSV ) – Vanguard Short-Term Bond ETF (NYSEARCA: BIV ) – Vanguard Intermediate-Term Bond ETF (NASDAQ: VCIT ) – Vanguard Intermediate-Term Corporate Bond ETF (NYSEARCA: BLV ) – Vanguard Long-Term Bond ETF (NASDAQ: VCLT ) – Vanguard Long-Term Corporate Bond ETF AGG – iShares Core Total US Bond Market ETF Table 1 – Box Paradigm: U.S. Fixed Income ETF Portfolio As At January 30 th 2015 (click to enlarge) Environment Outside The Box The environment should first be ascertained, so that a proper box can be constructed. In its latest FOMC statement, the Fed thinks that the U.S. economy is growing at a solid pace. Labor market indicators have improved further as job gains grew and the unemployment rate fell. Household spending is also showing signs of improvement as a result of the decline in energy prices. Businesses have also been investing while core inflation remains low but stable. Table 2 – Economic Projections Of Federal Reserve Board Members And Federal Reserve Bank Presidents, December 2014 (click to enlarge) Source: Federal Reserve Charts 1-3: Central Tendencies Of Economic Projections, 2014-2017 And Over The Longer Run Source: Federal Reserve Initial estimates show that U.S. GDP grew 2.5% year over year in the 4th quarter of 2014. This rate is above the 4-quarter moving average of 2.4%, so the U.S. is still growing at an above-trend pace. Consumer spending was strong as real PCE rose 4.3% versus 3.2% in the previous quarter. This was the strongest quarterly increase in the post-financial crisis era. Residential investment improved given the loosening of mortgage credit and this trend is likely to continue. Chart 4 – U.S. GDP Growth (Year-Over-Year %) As At December 2014 (click to enlarge) Source: Bloomberg Given the current moves in the U.S. economy and expectations for a rate hike in the 3rd quarter of 2015, yields in the U.S. should be rising. But they are not. The U.S. 10-year yield is nearing historical lows, around 1.65%. The chart below shows a 3-year chart of the U.S. 10-year yield. Chart 5 – U.S. 10-Year Yield Weekly Candlestick Chart As At January 30 th 2015 (click to enlarge) Source: Bloomberg Quantitative Easing of other central banks appears to be keeping U.S. yields low as investors shift their portfolios from their local currency fixed income portfolios to U.S. dollar-denominated portfolios to attain the higher yield. Assumptions & Box Metrics Trying to predict market movements produces a certain level of cynicism as there is a 60% probability that the prediction made is wrong. With this level of duplicity, investors should assume the worst-case scenarios which would prevent ruin but leave room for gains, a personal put option. Let us take a look at the table below which shows the box metrics of the U.S. Fixed Income ETF Portfolio. Table 3 – Box Metrics Of U.S. Fixed Income ETF Portfolio (click to enlarge) The box paradigm portfolio weightings hold until the triggers are achieved, that is, a recognizable change in the interest rate environment in the U.S. Furthermore, box constructions prevent chasing the market and ensure that the objectives are set and met. Disclosure: The author has no positions in any stocks mentioned, and no plans to initiate any positions within the next 72 hours. (More…) The author wrote this article themselves, and it expresses their own opinions. The author is not receiving compensation for it (other than from Seeking Alpha). The author has no business relationship with any company whose stock is mentioned in this article.