Tag Archives: nreum

Niska Gas Is Likely Undervalued Currently

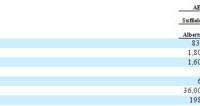
Summary NKA is being sold at a heavy discount to book value and free cash flows based on historical financial analysis. NKA will likely do quite well financially during the current volatile gas price environment. Even if NKA decides to cut dividends, the current price seems very attractive. Investors should not take a large position currently in the case that dividends are cut and the units become even more attractively priced. Niska Gas Storage Partners LLC (NYSE: NKA ) is a company that operates gas storage assets totaling roughly 250 Bcf of natural gas storage capacity in certain areas of North America. Being in the storage industry, the effects of supply and demand in the natural gas industry may not affect NKA the same way as it affects other oil and natural gas concerns. While natural gas supply is relatively stable over the short term, demand may fluctuate quite a lot due to seasonal, weather or other reasons. Therefore, storage assets can be useful when prices are unduly low and used to save gas supplies for when prices rebound to higher levels. There are a few ways that NKA protects itself from the fluctuations in gas prices or perhaps more importantly, fluctuations in the usage of storage facilities by gas and utility companies. Storage might be thought of as a hedge against price volatility and therefore, it may even benefit from exceptionally low gas prices than normal. The company enters into long-term firm (LTF) contracts in which customers pay the company monthly reservation fees for the right to use the storage facilities over a multi-year agreement. These LTF fees must be paid regardless of the actually utilization of storage capacity by the customers. Then there are variable fees that are charged based on usage of the facilities but they represent a very small portion of the fees received under LTF contracts. Therefore, on a qualitative live, the greater part of NKA’s revenue stream should be relatively stable and constant under most circumstances regardless of the direction of gas prices. The extraordinary situation would be if the supply of natural gas were to actually become in danger of being disrupted or if NKA’s customers were to experience financial failure on a large scale. This would put severe stress on the company’s revenue stream and thus severely cripple its ability to service debt. This scenario would happen if gas prices stay below profitability levels for the producers over a prolonged period of time. In the short term, it may even positively impact NKA’s profitability as low prices would beckon more usage of storage capacity. (click to enlarge) NKA’s largest operation is in Alberta with a facility in each of Suffield and Countess which act as a single hub known as the AECO hub. The weighted average contract life of LTF storage contracts in the AECO hub was 2.3 years as of March 31, 2014. As long as those customer companies manage to stay solvent, NKA’s revenues from AECO should be able to weather a fairly long period of low oil prices. Especially since the fact that TransCanada, a large customer of NKA re-implemented its contract making the weighted average life 4.2 years. The weighted average contract life of the LTF storage contracts at Wild Goose is 2.0 years. Salt Plains is 3.0 years. While LTF contracts comprise of the larger part of NKA’s total revenues, they also have Short Term Firm (STF) contracts which also accounts for a material part of their revenues. The company uses a combination of LTF, STF and other revenue optimization techniques to obtain as high an amount of revenue as possible depending on the market situation. The nature of LTF contracts is that the revenue stream is set during the window of when the contracts expire and is renegotiated for the years going forward. Thus, the revenue from this stream have little to do with the day to day fluctuations of the gas markets and is determined by the conditions prevailing when the contract is being renegotiated. The STF contracts are negotiated on an opportunistic basis and this source is more susceptible to the shorter term fluctuations of the greater market. The current scenario The poor performance in the recent quarter was largely due to the inability of the company to find attractive STF contracts. This is partially attributable to the fact that there has been a lack of energy price volatility due to a moderately cool summer in the areas served by NKA. The trend has now reversed and storage capacity will likely be in high demand due to the recent fallout in oil and gas prices. NKA’s facilities will be in short supply when producers become very uncertain about the future prospects of oil prices since storage capacity basically acts as limited type of insurance protection against uncertain prices. In that sense, although I never like to depend on predictions for the future, NKA’s future prospects for both STF and LTF contracts are looking very bright at the moment. The greater the spread in energy prices, the more valuable will be NKA’s storage assets. Restrictive ownership structure The company is effectively controlled by its sponsor HoldCo and there really isn’t any effective control given to the general public shareholders. Furthermore, the company states that if the manager or any of their affiliates own 80% more of the outstanding units, then they have the right to purchase all of the remaining units from the public unit holders at the prevailing market price. This makes holding NKA very unattractive if you were to have paid the full price of $16.00 for the units. However, at $4.00 per unit, the potential risk is much lower and the reward potential is much greater and more attractive. Should the controlling sponsors decide to acquire the entire outstanding units, there is far less risk of selling it for lower than your acquisition price when purchased at $4.00 per unit. Financial analysis Reviewing the historical performance of NKA, it would seem that the current market cap of around $140 million is unduly cheap. The cash available for distribution metric that NKA discloses should be a rough approximation of free cash flow to equity. If we take the year over year results so far, the stock is trading at merely two times free cash flow. The stock was roughly $16.00 per share and has now dropped to less than $4.00 per share based only on one quarter of poor results due to a shortfall in STF business. The company pays out $1.40 in dividends per year which amounts to roughly $51 million in total. The 2nd quarter call conference suggested that the dividend may be reduced or cut altogether going forward which is what caused the collapse in share price. Analyzing the historical financial data along with the current drop in prices, NKA appears to be extremely cheap at the moment not only due to the free cash flow record, but it also trades at such a small fraction of book value. (click to enlarge) Conclusion Even if the dividends were to be cut completely, I believe the unit price should still be worth roughly $6.00 per share when taking into consideration all the risks. Indeed, the share price will likely drop if dividends were to be cut but the fundamentals of the company are sound and should even do quite well under the current volatile oil and gas price regime. The investment is certainly a portfolio of depreciating assets and the maintenance capital expenditures will increase to roughly $10 million per annum going forward. However, this will not affect the fundamental cash flows to equity going forward to warrant a 70-80% drop in the price. There is ample protection in terms of discount to book value as well as the historical free cash flow performance to warrant a small purchase for me at the current prevailing market price. I’ve only taken on a small position because I want to have a lot of dry powder left over if they should actually cut the dividend and the price would fall further. However, I believe that at the current price, NKA is attractive even if it does cut its dividends.

3 Best-Rated Utilities Mutual Funds To Invest

Even during a market downturn, the demand for essential services such as those provided by utilities remains virtually unchanged. Utilities funds are therefore an excellent choice for investors seeking a steady income flow through consistent yields from dividends. This is also why they are primarily considered to be a relatively more conservative investment option. In recent times, their forays into emerging markets have led to appreciably higher returns and they offer superior returns at a relatively lower level of risk. Below, we will share with you 3 top rated utilities mutual funds. Each has earned a Zacks #1 Rank (Strong Buy) as we expect the fund to outperform its peers in the future. To view the Zacks Rank and past performance of all utilities funds, investors can click here to see the complete list of funds . Fidelity Select Utilities Portfolio (MUTF: FSUTX ) seeks capital growth over the long run. The fund invests a lion’s share of its assets in common stocks of companies primarily involved in utilities sector, and companies that derive major portion of its revenue from operations related to this sector. The fund invests in both U.S. and non-U.S. firms. The fund considers factors such as financial strength and economic condition to invest in companies. The non-diversified utilities mutual fund has a three year annualized return of 17.8%. The utilities mutual fund has a minimum initial investment of $2,500 and an expense ratio of 0.80% compared to a category average of 1.28%. Fidelity Advisor Utilities A (MUTF: FUGAX ) invests a major portion of its assets in utilities companies or carry out operations related to the utilities industry. Factors such as industry position and market condition are considered to invest in companies throughout the globe. The fund seeks long-term capital growth. The non-diversified utilities mutual fund has a three-year annualized return of 16.9%. The fund manager is Douglas Simmons and he has managed this utilities mutual fund since 2006. Fidelity Telecom and Utilities Fund (MUTF: FIUIX ) seeks total return with current income and capital growth. It invests heavily in companies from telecommunications services and utilities sector. The fund invests in companies all over the globe by analyzing factors which include company’s economic condition and financial strength. The non-diversified utilities mutual fund has a three-year annualized return of 15.4%. As of October 2014, this utilities mutual fund held 36 issues, with 19.96% of its total assets invested in Verizon Communications (NYSE: VZ ). Now that you’ve read this, are you Bullish or Bearish on ? Bullish Bearish Sentiment on ( ) Thanks for sharing your thoughts. Why are you ? Submit & View Results Skip to results » Share this article with a colleague

Momentum And Rebalancing Of Retirement Income Portfolios

Summary Robust investment portfolios can be constructed with just two ETFs: one representing the total stock market and another representing the total bond market. From November 2003 to December 2014, the ETF portfolio with fixed allocation allowed a safe 4% annual withdrawal rate and achieved a 28.95% increase of the capital. Better returns were achieved by rebalancing the portfolio at 25% deviation from the target weights. Capital increased by 43.66%, average annual return of 3.35%. Radically better performance is achievable using adaptive asset allocation. With a safe 4% withdrawal rate, the capital increased by 164.93%, average annual return of 9.26%. ETF portfolio performs essentially the same as its mutual fund counterparts. The comparison of their performance is evident in the tables included in the article. In a couple of recent articles , we demonstrated that a very simple and well diversified portfolio may be made up of two instruments, one representing the total stock market, and the other the total bond market. These portfolios are quite robust and achieve decent returns using simple strategies as rebalancing and momentum based adaptive allocation. At the suggestion of some readers, we investigate the suitability of these portfolios as retirement investments for income generation and capital appreciation. From many possibilities, I selected the following three portfolios: one built with iShares and Vanguard ETFs, the second with Vanguard mutual funds, and the third with Fidelity mutual funds. ETFs portfolio: iShares Core US Aggregate Bond Market ETF (NYSEARCA: AGG ) and Vanguard Total Stock Market ETF (NYSEARCA: VTI ). Mutual funds portfolio: Vanguard Total Bond Market Index Fund (MUTF: VBMFX ) and Vanguard Total Stock Market Index Fund (MUTF: VTSMX ). Mutual funds portfolio: Fidelity Total Bond Market Index Fund (MUTF: FTBFX ) and Fidelity Spartan Total Stock Market Index Fund (MUTF: FSTMX ). For purposes of comparison we simulate these portfolios from November 2003 to December 2014, a total of eleven years. The time period of the study was selected based on the availability of historical data of the investment instruments; AGG was created in September 2003. In this article, three different strategies will be considered: Portfolio is 50% stocks and 50% bonds without rebalancing. Portfolio is created with 50% stocks and 50% bonds; it is rebalanced when the allocation deviates by 25% from the 50 target, when the allocations become 62.5% and 37.5%. Portfolio is at all times invested 100% in either stocks, or bonds. The switching, if necessary, is done monthly at closing of the last trading day of the month. All the funds are invested in the instrument with the highest return over the previous 3 months. The data for the study were downloaded from Yahoo Finance on the Historical Prices menu for the six tickers. We use the monthly price data from September 2003 to November 2014, adjusted for stock splits and dividend payments. The time selection is restricted by the availability of data; AGG was created in September 2003. Portfolios with fixed weights with withdrawals, no rebalancing Assume that we have $1,000,000 to invest for income in retirement. We plan to withdraw 4% annually plus a 2% inflation adjustment. The withdrawals are done monthly. Over the 11 years from 2003 to 2014, a total of $488,000 was withdrawn. The first table shows the results of the portfolios created with 50% AGG and 50% VTI, and their Vanguard and Fidelity mutual fund counterparts. The monthly withdrawal is done such a way that the weights of the two components are brought back toward the target of 50-50. Below, we show the hypothetical behavior of these equal weight portfolios from November 2003 to December 2014. The maximum drawdowns of the portfolios are larger than that of the same portfolios without income withdrawals, because the withdrawals decrease the equity. On the average the returns are greater than the withdrawals, so the total capital is increasing . The CAGR columns give the cumulative average growth rate of the capital. Table 1. Fixed allocation portfolios without rebalancing CAGR% Max DD % Final Equity AGG + VTI 2.40 -28.29 1,298,500 VTSMX + VBMFX 2.40 -28.34 1,298,100 FSTMX + FTBFX 3.05 -32.75 1,392,100 The plots of the portfolios are shown in figure 1. The values are shown in percentages of the initial investment. (click to enlarge) Figure 1. Equities of portfolios with 4% annual withdrawal without rebalancing. Source: This chart is based on EXCEL calculations using the adjusted monthly closing share prices of securities. Portfolios with fixed weights with withdrawals and rebalancing As before, we assume that we have $1,000,000 to invest for income in retirement. We plan to withdraw 4% annually plus a 2% inflation adjustment. Over the 11 years from 2003 to 2014, a total of $488,000 was withdrawn. The only difference of the strategy is that we rebalance the portfolio when the allocation between stocks and bonds deviates by 25% from the 50% target. The rebalance happens when the allocations become 62.5% and 37.5%. During the 11 years of our study there was only one rebalancing. But, as can be seen in Table 2, the rebalance contribute to a substantial increase in returns. Table 2. Fixed allocation portfolios with rebalancing CAGR% Max DD % Final Equity AGG + VTI 3.35 -28.29 1,436,600 VTSMX + VBMFX 3.31 -28.34 1,430,800 FSTMX + FTBFX 3.45 -32.75 1,451,700 The plots of the portfolios are shown in figure 2. The values are shown in percentages of the initial investment. (click to enlarge) Figure 2. Equities of portfolios with 4% annual withdrawal and rebalancing. Source: This chart is based on EXCEL calculations using the adjusted monthly closing share prices of securities. To appreciate the improvement obtained by rebalancing, in figure 3 are shown the equities for the ETF portfolio with and without rebalancing. (click to enlarge) Figure 3. ETF portfolios with fixed allocations Source: This chart is based on EXCEL calculations using the adjusted monthly closing share prices of securities. Adaptive Asset Allocation What we presented so far is a robust example from which one can infer that portfolio rebalancing has some positive effect in improving returns of a retirement investment. Another approach, with significant better results is to apply an adaptive asset allocation based on price momentum. We consider again the ETF portfolio of VTI and AGG by switching between two allocations: 100% AGG and 0% VTI 0% AGG and 100% VTI The switching is done monthly, on the last trading day of the month, using the following rule: invest fully in the asset with the highest return during the most recent 3 months. From November 2003 to November 2014, there were 25 reallocations of the ETF portfolio. The system was invested 88 months in VTI, and 44 months in AGG. The adaptive allocation system based on momentum achieved much higher return and lower drawdown than the fixed allocation system with or without rebalancing. Similar results were obtained with the Vanguard and Fidelity mutual funds. Those portfolios required 27 reallocations during the 11 years of the study. The Vanguard portfolio was invested 87 months in VTSMX, and 45 months in VBMFX. The Fidelity portfolio was invested 87 months in FSTMX, and 45 months in FTBFX. Table 3. Adaptive allocation portfolios CAGR% Max DD % Final Equity AGG + VTI 9.26 -18.18 2,649,300 VTSMX + VBMFX 8.22 -18.67 2,384,300 FSTMX + FTBFX 7.61 -24.97 2,241,700 The plots of the portfolios are shown in figure 1. The values are shown in percentages of the initial investment. (click to enlarge) Figure 4. Adaptive Allocation Portfolios Source: This chart is based on EXCEL calculations using the adjusted monthly closing share prices of securities. Conclusion The adaptive allocation algorithm performed substantially better than the fixed allocation algorithms regardless of the type of market. It generated much higher returns with lower risk. For a comparison see figure 5. (click to enlarge) Figure 5. ETF portfolios with monthly withdrawals 2003-2011. Source: This chart is based on EXCEL calculations using the adjusted monthly closing share prices of securities.