Tag Archives: nreum

Falling U.S. Inflation Could Drive Up SLV

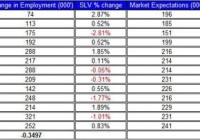
The price of SLV rallied by 5% during the year, up to date. Falling U.S. inflation may pull up SLV via the drop in U.S. treasury yields. The recent Non-farm payroll was inline with market expectations, but it didn’t drag down SLV. After losing nearly 8% during the last quarter of 2014, the iShares Silver Trust ETF (NYSEARCA: SLV ) showed some signs of recovery as its price added over 5% during this month. Even the strong results from the last non-farm payroll report didn’t curb down the price of SLV from picking up. Let’s review the relation among the developments in the U.S. labor market, inflation and the progress of SLV. The non-farm payroll report was published on Friday. It showed a 252 thousand of jobs added during December. Moreover, the previous two months were revised up by 50 thousand jobs. The rate of unemployment slipped to 5.6%. The table below shows the changes in SLV and the non-farm payroll results in 2014. Source of data taken from Bureau of Labor Statistics As you can see, the correlation between the changes in the gap between market projections and actual figures and the price of SLV is mid-strong and negative at -0.45 – this result suggests that as long as the number of jobs added doesn’t exceed market expectations, the price of SLV is likely to rally. Despite the recent rise of SLV last week, the ongoing recovery of the U.S. labor market doesn’t play in favor of SLV. This recovery, however, still has a long way to go until the U.S. labor market shows a full recovery – mainly in wages. Based on the recent report, hourly wages grew by only 1.7% on an annual pace. This is still a low level and remains well below the levels recorded before the 2008 economic meltdown. The other major report related to the U.S. labor market is the upcoming JOLTS report, which will be published this week. (click to enlarge) Source of data taken from Bureau of Labor Statistics Albeit the price of SLV doesn’t have as strong relation to the JOLTS figures as it does with the non-farm payroll. This is still an important report that could indicate the progress of the U.S. economy. The current estimates are for the report to show a 4.91 million jobs opening. The upcoming U.S. CPI and PPI, which will be released this week, could provide another measurement about the changes of the U.S. inflation. If the U.S. core inflation continues to slowly come down, this doesn’t vote well for rise in U.S. wages. The fall in U.S. inflation, however, could actually play in favor of SLV. At the very least, it may play this year in two roles when it comes to SLV. Usually, lower inflation tends to steer away investors, who fear of a potential spike in inflation, from precious metals investments such as SLV. The chart below presents the relation between core CPI and SLV during 2013-2014. Source of data taken from Bureau of Labor Statistics and Google finance Most of the drop in U.S. inflation was stemmed, as you well know, from falling oil prices. During the past few months, the correlation between SLV and oil prices was mid-strong and positive at 0.4. Albeit the price of SLV remained relatively flat, oil prices tumbled down by more than 40% in the past three months. So why falling oil prices could actually be good for SLV? As U.S. inflation falls, this is likely to reduce the odds of the FOMC raising rates. For now, the market still expects the FOMC to raise rates by the middle of the year. Alas, if U.S. inflation does tumble down, it could eventually influence FOMC members to reevaluate their policy. Finally, falling U.S. inflation is also likely to keep down U.S. long term treasuries yields, which tend to have a negative relation with the price of SLV. Therefore, falling long term treasuries yields driven, in part, by lower inflation provide the environment needed to keep pulling up SLV. For more see: Choosing Between Gold and Silver

Lack Of U.S. Wage Growth Puts These ETFs In Focus

The U.S. is creating jobs fast, but is slow in boosting wage growth. While the buzz about poor wage growth has been doing rounds for long, the unexpected and steepest fall in average U.S. hourly wage for December since 2006 cast a dark cloud over the country’s economic growth story. Average hourly earnings dipped 0.2% sequentially in December, and November average hourly earnings were adjusted down to a 0.2% increase. On a year-over-year basis, average hourly earnings in December were up 1.7%. This indicates that the brighter overall job picture was courtesy of the low-wage category. Thanks to this downbeat data, positive sentiments that shaped up over the U.S. investing in last few months, suffered a brief (seemingly) setback to start 2015. The U.S. dollar dipped against the yen, though slightly, following not-so-enthusiastic payrolls. Several emerging market currencies, however, including Taiwan’s dollar and Indonesia’s rupiah had witnessed a notable ascent following the payroll data. The WisdomTree Emerging Currency ETF ( CEW) , which provides a diversified play on emerging market currencies, added 0.24% on January 9th. Added to this is the inflationary outlook, which will likely remain grave in the days to come due to the unending oil rout. In fact, a beneficial driver like lower greenback also failed to perk up oil investing. Bloomberg analysts envisaged that U.S. consumer prices possibly grew 0.7% year over year in December, the five-year lowest. Most of the market participants started to believe that a solemn inflationary picture and a lackluster wage scenario will delay the hike in U.S. interest rates. We expect this shaky investor sentiment to take charge of the market movement at least for a few days. An upbeat economic data report is urgently needed to lift investors’ mood which is already sinking due to global growth worries. Greenback Gives Up Given the change in the market fundamentals and slide in the greenback following the latest wage data, investors might think about shorting U.S. dollars to take advantage. PowerShares DB U.S. Dollar Bearish Fund (NYSEARCA: UDN ) This fund could be the prime beneficiary of the falling USD as it offers exposure against a basket of world currencies. These include the euro, Japanese yen, British pound, Canadian dollar, Swedish krona and Swiss franc. This is done by tracking the Deutsche Bank Short U.S. Dollar Index Futures Index Excess Return plus the interest income from the fund’s holdings of U.S. Treasury securities. In terms of holdings, UDN allocates nearly 57.6% in euros while 25% collectively is in Japanese yen and British pounds. All of these currencies nudged up after the U.S. wage growth report. The $37.1 million fund charges 80 bps in fees a year from investors. This ETF was up 0.5% on January 9 but failed to sustain the gains after hours. Tilt to Treasuries Like 2014, the 10-year Treasury note too was off to a great start this year with yield slipping even below 2% since October. Notably, this was the best yearly start treasuries experienced in 17 years thanks to a spike in market volatility. Demand for 30-year treasury bonds was so high that yields plunged to the lowest level since July 2012. Investors seeking to ride this environment might take interest in iShares 20+ Year Treasury Bond ETF (NYSEARCA: TLT ) . This ultra-popular long-term Treasury ETF with an asset base of $6.6 billion – TLT – has added more than 4% so far in the New Year. TLT charges 15 bps in fees. Glitters of Gold After a tumultuous 2014, gold finally heaved a sigh of relief. Soft global growth, persistent plunge in oil and now the prospect of a delayed rate hike in the U.S. returned the shine of the yellow metal. On January 9, the SPDR Gold Trust ETF (NYSEARCA: GLD ) – the product tracking gold bullion -added about 1.14%. In the year-to-date frame, this $27.6 billion fund was up 3.2%. The ETF charges 40 bps in fees. Bottom Line As a caveat, investors should note that the outlook is quite rough for the inverse dollar and gold ETF. This is more the case for UDN, which tracks the greenback against currencies like the presently nine-year low euro. These ETFs will turn out winners as long as volatility and downbeat sentiments over the U.S. market prevail. Thus, investors need to be aware of the market at large before considering these investment options.

3 New Nontraditional Bond Funds Hit The Market

By DailyAlts Staff As fixed-income investors face asymmetrical interest-rate risk and other headwinds in 2015, nontraditional bond funds are looking more and more attractive. Such funds are often referred to as “go anywhere” funds, since they’re allowed to “go anywhere” in pursuit of their investment objectives. Three such funds were launched in the final month of 2014, as outlined below: Counterpoint Tactical Income As a new entrant into the liquid alternatives field, Counterpoint Mutual Funds launched its first mutual fund last month, the Counterpoint Tactical Income Fund. The fund has a focus on investing in high yield securities (including bonds, bank loans, floating rate bonds and debt and municipal high yield debt), but doing so when the firm’s algorithms identify trends that point to a risk-on environment. In risk-off environments, as identified by the firm’s trend-following algorithm, the fund will be allocated to less risky assets such as U.S. Treasuries and cash. The fund also has the ability to invest in derivatives to hedge against credit and interest rate exposure. The fund will pursue its tactical-income strategy by investing in mutual funds, closed-end funds, and ETFs, but also has the ability to invest directly in individual securities directly. In addition, the fund is permitted to use up to 33 1/3% leverage to pursue its objective of income and capital preservation. The fund is managed by the firm’s two founders, Michael Krause and John Koudsi, and carries a relatively high management fee of 1.25%. The fund is available in three share classes: A (MUTF: CPATX ), C (MUTF: CPCTX ), and I (MUTF: CPITX ); with respective net-expense ratios of 2.60%, 3.35%, and 2.35%. This compares to an average expense ratio of 1.30% for Morningstar’s Nontraditional Bond category. The minimum investment for A- and C-class shares is $5,000; while the minimum required for I-class shares is $100,000. For more information, download a pdf copy of the fund’s prospectus . Transamerica Unconstrained The Transamerica Unconstrained Bond Fund (ticker: TUNAX ) was launched on December 5, and like other Transamerica funds, this fund’s investment management is outsourced to an external sub-advisor. In this case, the fund’s sub-advisor is PineBridge Investments , which also manages the Transamerica Inflation Opportunities Fund (ticker: TIOAX ). The fund’s objective is to maximize returns through a combination of interest income and capital appreciation. PineBridge pursues this objective by employing an “unconstrained” style, taking long and short positions in debt instruments across sectors, geographies, capitalizations, and credit grades. PineBridge’s investment decisions are based on macroeconomic analysis that determines asset allocations, as well as specific investments within those allocations. The fund’s duration is expected to generally stay in the range of -3 years to +10 years. The fund is available in A- (TUNAX), C- (MUTF: TUNBX ), and I-class (MUTF: TUNIX ) shares, with a management fee of 0.64% and a relatively low net-expense ratios of 1.14%, 1.89%, and 0.89%, respectively. The minimum investment for A- and C-class shares is $1,000; while the minimum for I-class shares is $1 million. For more information, read the fund’s prospectus . Sentinel Unconstrained Finally, the Sentinel Unconstrained Bond Fund launched on December 23. The fund has the latitude to invest in U.S. and non-U.S. fixed income securities of any credit quality, can use shorting and derivatives and will maintain its duration in the range of -5 years to +10 years. The fund can also hold up to 20% in equity securities. Jason Doiron, portfolio manager and Head of Investments with Sentinel, will be the fund’s portfolio manager. The fund’s shares are available in A- (MUTF: SUBAX ), C- (MUTF: SUBCX ), and I-class (MUTF: SUBIX ) shares; with a 0.75% management fee and respective net-expense ratios of 1.56%, 3.56%, and 1.14%. Like the Transamerica Unconstrained Bond Fund, the minimum investment for A- and C-class shares is $1,000; while the minimum for the institutional I-class shares is $1 million. For more information, read the fund’s prospectus .