Tag Archives: nreum

Investors Still Betting On Oil ETFs

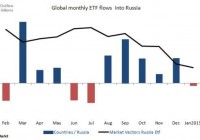
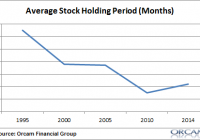
Summary Russian ETF inflows continued to add exposure to the country in 2014, but first signs of outflows in 2015. Oil ETFs have seen net inflows of $1.3bn so far this year. Investors have pulled $80bn from gold ETFs since 2012. Collapsing oil prices and the free falling Russian market have so far not tested the patience of ETF investors, who continued to double down on these loss-making trades in 2014; a stark contrast to 2013’s gold slump when ETF investors rushed to the door. ETF investors’ Russian affair Russian exposed ETFs saw consistent inflows of $1.5bn in the last five months of 2014 as the Russian market continued to decline with sanctions, declining oil prices and the devaluing rouble hitting the market. However, while these inflows were occurring, the largest Russian exposed ETF, the Market Vectors Russian ETF (NYSEARCA: RSX ), saw its price decrease by over a third from August to December 2014. This trend looks to be reversing somewhat in the New Year, as Russian exposed ETFs are on track for their first monthly outflows in six months, as investors’ resilience and staying power may have begun to wane. Chasing oil’s bottom Oil prices have slid by 50% since mid-June 2014 and the largest Oil ETF, the United States Oil Fund (NYSEARCA: USO ) with AUM of $1.7bn, is down by a parallel 54% over the same time period. ETF investors are continuing to ‘double down’ after catching knives over the past four months while oil prices continued to decline. Prices are currently hovering at $46 per barrel (Brent). Investors’ faith in an oil price recovery seems to have increased, as fund flows into oil exposed ETFs look set to beat December’s total inflows of $1.7bn, with inflows so far this month already standing at $1.3bn. Interestingly, oil was at similar price level back in 2009, when we also saw strong inflows into oil ETFs after a dramatic collapse in global oil prices. ETF investors could see more red in the short term though, as news out this week reveals record oil imports for China hitting highs of 7m barrels per day. These have been cited as being destined for strategic and commercial reserves. Turning against gold Gold has not been so precious in the eyes of ETF investors, as ETFs exposed to the metal’s price movements have continued to see sustained outflows over the last two years. The last two years has seen only four months of net inflows. This comes as the commodity declined from 2011 highs of ~$1800, stabilising at $1259 currently. The end of quantitative easing in the US and an expectation of a strengthening dollar and weaker global demand has seen the precious metal fall out of favour with investors. The largest gold ETF, the SPDR Gold shares ETF (NYSEARCA: GLD ) has $28bn AUM which represents 44% of total AUM exposed to the metal. This AUM figure has fallen by over 60% from the $72bn it managed at start of January 2013.

Watch These Europe ETFs If The ECB Prints Money

The European Central Bank (ECB) is apparently set to embark on the final voyage of its easing policy. At least, the ECB president Mario Draghi’s latest comments in a German financial newspaper give such cues. Going by what Draghi said, we can comprehend that the ECB is all for bank reforms, levying lower taxes and slashing excessive regulations to accelerate the Euro zone’s recovery, which the president was quoted as saying that it is presently “fragile and uneven.” The Euro zone’s manufacturing activity expanded slower than initially estimated in December with each month of Q4 recording the lowest PMIs since Q3 of 2013. Such downbeat data definitely creates a backdrop for the initiation of the QE policy. Thus, investors considered the president’s latest comments as the start of an asset buyback program or some other sort of stimulus program. Sensing potential easing, the common currency euro plunged to a nine-year low against the greenback. As a result, the CurrencyShares Euro Trust ETF (NYSEARCA: FXE ) kick started the New Year with a decent sized loss. Gains were invisible even in the broad large-cap Euro ETFs including the Vanguard FTSE Europe ETF (NYSEARCA: VGK ) and the SPDR Euro STOXX 50 ETF (NYSEARCA: FEZ ) which shed in the range of 0.2% to 0.5% as well. Needless to say, in a falling euro backdrop, hedged Europe ETFs turned out as winners as evidenced by the 0.6% gains offered by the WisdomTree Europe Hedged Equity ETF (NYSEARCA: HEDJ ). But some other areas of Europe investing should be closely watched if the ECB jumps on the bandwagon of QE movement like the U.S. and Japan have already implemented. Normally, smaller companies pick up faster than the larger ones in a growing economy. Since these pint-sized securities usually focus more on the domestic market, these are less ruffled by international worries than their globally exposed larger counterparts. This is especially true as a pile of woes hit the global economy last year. In short, likely monetary easing and currency weakness would support European consumption which in turn may boost small cap ETFs. Per CNBC , a sluggish euro will trigger purchases by the domestic consumers as they will have to pay less money for buying domestically manufactured goods than imported ones. Low oil prices should be another drive to spur consumer purchases. Investors should note that U.S. small-cap stock index Russell 2000 added about 85% return when the QE policy was underway. So, investors can expect the replication of the same trend on the European front. Market Impact Unlike VGK, the WisdomTree Europe SmallCap Dividend ETF ( DFE ) has added about 0.5%. Below, we highlight three ETFs that should be in focus if the QE is actually implemented. DFE in Detail This ETF provides exposure to the small cap segment of the European dividend-paying market by tracking the WisdomTree Europe SmallCap Dividend Index. It is one of the popular funds in the European space with AUM of $698 million. The fund charges 58 bps in annual fees from investors. The fund is heavy on industrials as this segment accounts for more than one-fourth of the portfolio while financials, information technology and consumer discretionary take the remainder. Among countries, United Kingdom (32.6%), Sweden (14.6%), Italy (9.5%) and Germany (8.7%) dominate the holdings list. Heavy focus on some of the better-positioned nations like the U.K., Sweden and Germany is positive of the fund. Plus, a tilt toward dividends was the icing on the cake in a yield-starved continent. The fund was down 1.62% in the last one month (the lowest loss in the space), but was up 0.8% in the last three months, indicating commendable performance in the pack of European ETF losers. iShares MSCI Germany Small Cap Index ETF ( EWGS ) Germany has been a better-placed economy in the Euro bloc. Zew Economic Sentiment Index in Germany expanded for the second successive month to 34.90 in December of 2014 from 11.50 recorded last month and also surpassed analyst expectations. The number was even higher than Euro Area average of 31.80 and 18.40 touched in the U.K. This gives EWGS – an ETF with $26.4 million under management – an edge over its other domestic cousins as well as broader Euro zone counterparts. The fund was up 4.44% in the last three month period – the second best show in the European pack, but lost about 2.4% in the last one month.

Market Timing Vs. Macro Decision Making

Here’s a very good post over at Brooklyn Investor on some of the differences between market timing and macro hedge funds. As more and more people become index fund investors I think these concepts become increasingly important to understand because all index fund investing is a form of macro investing (picking aggregates). But being an “asset picker” doesn’t make you a “market timer” in the sense that I think many people have come to think. First, market timers are people with extremely short time horizons. These are the people who think they can time the daily, weekly or monthly moves of the market. For some perspective, you can see how much the average holding period has declined over the years: If you go back even further in history the holding period used to be quite a bit longer (as high as 7 years). The crucial point in the discussion about how “active” an investor is really comes down to efficiency in decision making as opposed to “passive” vs “active” (since we’re all “active” to some degree). That is, we all deviate from global cap weighting, we all rebalance, lump sum invest, alter our risk profile, “factor tilt”, etc. Portfolio construction and maintenance is an active endeavor by necessity. The more important questions revolve around how we are optimizing frictions around our decisions. This comes down to two big points: Taxes will take between 15-38% of your profits. Reducing this friction is crucial. A tax aware investor not only uses the proper products to maximize after tax returns, but implements a portfolio that takes advantage of long-term vs short-term capital gains. Fees are the other big friction in a portfolio. As I’ve described before , the difference between using a 1% fee fund and a 0.1% fee fund over the long-term will result in tremendous outperformance: (The fee impact of $100,000 compounded at 7% with avg MF and low fee index) The smart macro investor knows that taxes and fees are a killer in the long-term. If the global financial portfolio generates a return of 7% per year then you can’t afford to be giving away 1% in fees every year and another 1-2%+ to the tax man every year. So here’s a safe rule of thumb – the difference between a “market timer” and someone who makes necessarily “macro decisions” (even if that’s just rebalancing, dollar cost averaging or making new contributions, etc) is 12 months and one day. Since taxes are such a large chunk of our real, real return then it makes sense to take a bit of a longer perspective. Rebalancing on a monthly or quarterly basis doesn’t add much value to your portfolio and increases fees & frictions significantly. At the same time, you have to be careful about the Modern Portfolio Theory concept of “the long-term.” As I described here , taking a “long-term” perspective could actually result in taking much more risk than is appropriate for you. Our financial lives are actually a series of short-terms within one longer time period so it’s best to treat your portfolio as a “savings portfolio” instead of a higher risk “investment portfolio”. As I’ve described in detail , we’re all active investors to some degree. We are all active asset pickers in a world where we all pick asset allocations that deviate from global cap weighting. That’s totally fine! So, the discussion really comes down to how efficient we are at picking our allocations and how we implement the process by which we manage that allocation. If you’re using a very short-term strategy that results in a holding period that is less than 12 months then I’d call you a market timer who is likely increasing your frictions and hurting your overall performance. If, however, you are making macro portfolio decisions in a more cyclical nature (over a year or several years on average) then you are a macro investor who is minimizing the negative impact of portfolio frictions. Of course, the discussion about how to efficiently or effectively we “pick assets” is a whole different discussion and opens up a whole new can of worms in the “active” vs “passive” debate….